Archive
Readability of anonymous inner classes and lambda expressions
The available evidence on readability is virtually non-existent, mostly consisting of a handful of meaningless experiments.
Every now and again somebody runs an experiment comparing the readability of X and Y. All being well, this produces a concrete result that can be published. I think that it would be a much more effective use of resources to run eye tracking experiments to build models of how people read code, but then I’m not on the publish or perish treadmill.
One such experimental comparison of X and Y is the paper Two N-of-1 self-trials on readability differences between anonymous inner classes (AICs) and lambda expressions (LEs) on Java code snippets by Stefan Hanenberg (who ran some experiments on the benefits of strong typing) and Nils Mehlhorn.
How might the readability of X and Y be compared (e.g., Java anonymous inner classes and lambda expressions)?
If the experimenter has the luxury of lots of subjects, then half of the subjects can be assigned to use X and half to use Y. When only a few subjects are available, perhaps as few as one, an N-of-1 experimental design can be used.
This particular study is worth discussing because it appears to be thought out and well run, as well as illustrating the issues involved in running such experiments, not because the readability of the two constructs is of particular interest. I think that developer choice of anonymous inner classes or lambda expressions is based on fashion and/or habit, and developers will claim the construct they use is the most readable one for them.
The Hanenberg and Mehlhorn study involved two experiments, using a N-of-1 design. In the first experiment task, subjects saw a snippet of code and had to count the number of parameters in either the anonymous inner class or the lambda expression (whose parameters were either untyped or typed); in the second experiment task subjects had to count the number of defined parameters that were used in the body of the anonymous inner class or lambda expression. English words were used for parameter names.
Each of the eight subjects saw the same set of randomly shuffled distinct 600 code snippets. The time taken to answer and correct/incorrect answer status were recorded. The snippets varied in the number of parameters and kind of construct; for task 1: 0-4 parameters, 3-kinds of construct, repeated 40 times, giving  distinct snippets; for task 2: 0-3 parameters used out of 3 parameters, 3-kinds of construct, repeated 50 times, giving
  distinct snippets.
The first task requires subjects to locate the definition of the construct, count the number of parameters, and report the count. The obvious model is different constructs require different amounts of time to locate, and that each parameter adds a fixed amount to the response time; there may be a small learning component.
Fitting a simple regression model shows (depending on choice of outlier bounds) that averaged over all subjects each parameter increased response time by around 80 msec, and that response was faster for lambda expressions (around 200 msec without parameter types, 90 msec if types are present); code+data. However, the variation across subjects had a standard deviation that was similar to these means.
The second task required subjects to read the body of the code, to find out which parameters were used. The mean response time increased from 1.5 to 3.7 seconds.
I was not sure whether to expect response time to increase or decrease as the number of parameters used in the body of the code increased (when the actual number of parameters is always three).
A simple fitted regression model finds that increase/decrease behavior varies between subjects (around 50 msec per parameter used); code+data. I am guessing that performance behavior depends on the mental model used to hold the used/not yet used information.
The magnitude of the performance differences found in this study mimics that seen in most human based software engineering experiments, that is, the impact of the studied construct is very small.
Readability: a scientific approach
Readability, as applied to software development today, is a meaningless marketing term. Readability is promoted as a desirable attribute, and is commonly claimed for favored programming languages, particular styles of programming, or ways of laying out source code.
Whenever somebody I’m talking to, or listening to in a talk, makes a readability claim, I ask what they mean by readability, and how they measured it. The speaker invariably fumbles around for something to say, with some dodging and weaving before admitting that they have not measured readability. There have been a few studies that asked students to rate the readability of source code (no guidance was given about what readability might be).
If somebody wanted to investigate readability from a scientific perspective, how might they go about it?
The best way to make immediate progress is to build on what is already known. There has been over a century of research on eye movement during reading, and two model of eye movement now dominate, i.e., the E-Z Reader model and SWIFT model. Using eye-tracking to study developers is slowly starting to be adopted by researchers.
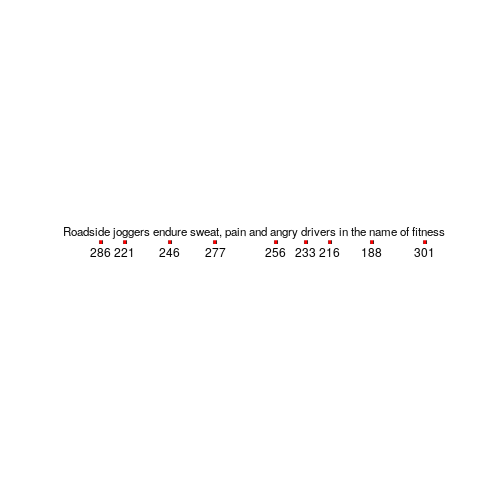
Our eyes don’t smoothly scan the world in front of us, rather they jump from point to point (these jumps are known as a saccade), remaining fixed long enough to acquire information and calculate where to jump next. The image below is an example from an eye tracking study, where subjects were asking to read a sentence (see figure 770.11). Each red dot appears below the center of each saccade, and the numbers show the fixation time (in milliseconds) for that point (code):
Models of reading are judged by the accuracy of their predictions of saccade landing points (within a given line of text), and fixation time between saccades. Simulators implementing the E-Z Reader and SWIFT models have found that these models have comparable performance, and the robustness of these models are compared by looking at the predictions they make about saccade behavior when reading what might be called unconventional material, e.g., mirrored or scarmbeld text.
What is the connection between the saccades made by readers and their understanding of what they are reading?
Studies have found that fixation duration increases with text difficulty (it is also affected by decreases with word frequency and word predictability).
It has been said that attention is the window through which we perceive the world, and our attention directs what we look at.
A recent study of the SWIFT model found that its predictions of saccade behavior, when reading mirrored or inverted text, agreed well with subject behavior.
I wonder what behavior SWIFT would predict for developers reading a line of code where the identifiers were written in camelCase or using underscores (sometimes known as snake_case)?
If the SWIFT predictions agreed with developer saccade behavior, a raft of further ‘readability’ tests spring to mind. If the SWIFT predictions did not agree with developer behavior, how might the model be updated to support the reading of lines of code?
Until recently, the few researchers using eye tracking to investigate software engineering behavior seemed to be having fun playing with their new toys. Things are starting to settle down, with some researchers starting to pay attention to existing models of reading.
What do I predict will be discovered?
Lots of studies have found that given enough practice, people can become proficient at handling some apparently incomprehensible text layouts. I predict that given enough practice, developers can become equally proficient at most of the code layout schemes that have been proposed.
The important question concerning text layout, is: which one enables an acceptable performance from a wide variety of developers who have had little exposure to it? I suspect the answer will be the one that is closest to the layout they have had the most experience,i.e., prose text.
Eye-tracking of developers reading code is now in start-up mode
Readability has always been the meaningless go to attribute for designers of new languages and code restructuring techniques that needed a worthy sounding benefit to tout.
Market researchers, being more interested in empirical data than arm-waving, have been long time users of eye-tracking technology; gaze direction providing a direct link to where cognitive attention is being invested.
Over the last few years a small number of researchers have started measuring where software developers look when they read code. Analysing and interpreting data on eye movement while reading code is still in start-up mode. One group has started collecting data that others can use, the obligatory R packages (saccade, gazepath and itsadug) and Python library now exist, and the eye-movement in programming conference has its third meeting in November.
Apart from one tantalizing image (see below, code+data here, original research paper+data) my book should arrive too soon to say anything useful about code readability based on eye-tracking data.
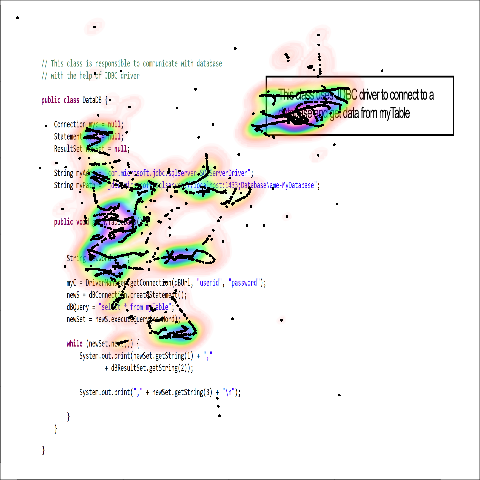
It has taken several decades for researchers to create reasonably reliable models of attention and eye-movement for reading text. Code reading adds vertical eye-movement to the horizontal movements that occur when reading text; the models are probably going to be a lot more complicated. I discussed a few of the issues in my first book (the E-Z Reader model is still one of the top performers).
Accurately tracking eye motion during software development is technically difficult. Until recently obtaining the necessary accuracy required keeping the subject’s head fixed (achieved by having subjects clamp their teeth on a bite bar); somewhat impractical for developers wanting to view a large screen. Accurately tracking what developers are looking at requires tracking both head and eye motion. The necessary hardware is coming down in price, but still contains one too many zeroes for me to buy one to play with (I was given an Intel RealSense at a hackathon, now I just need the software…).
Next time somebody claims that so-and-so is more readable, ask them what eye-tracking research has to say on the subject.
Agreement between code readability ratings given by students
I have previously written about how we know nothing about code readability and questioned how the information content of expressions might be calculated. Buse and Weimer ran a very interesting experiment that asked subjects to rate short code snippets for readability (somebody please rerun this experiment using professional software developers).
I’m interested in measuring how well different students subjects agree with each other (I have briefly written about this before).
Short answer: Very little agreement between individual pairs, good agreement between rankings aggregated by year.
The longer answer is below as another draft section from my book Empirical software engineering with R book. As always comments welcome. R code and data here.
Readability
Source code is often said to have an attribute known as
A study by Buse and Weimer <book Buse_08> asked Computer Science students to rate short snippets of Java source code on a scale of 1 to 5. Buse and Weimer then searched for correlations between these ratings and various source code attributes they obtained by measuring the snippets.
Humans hold diverse opinions, have fragmented knowledge and beliefs about many topics and vary in their cognitive abilities. Any study involving human evaluation that uses an open ended problem on which subjects have had little experience is likely to see a wide range of responses.
Readability is a very nebulous term and students are unlikely to have had much experience working with source code. A wide range of responses is to be expected and the analysis performed here aims to check the degree of readability rating agreement between the subjects.
Data
The data made available by Buse and Weimer are the ratings, on a scale of 1 to 5, given by 121 students to 100 snippets of source code. The student subjects were drawn from those taking first, second and third/fourth year Computer Science degree courses and postgraduates at the researchers’ University (17, 65, 31 and 8 subjects respectively).
The postgraduate data was not used in this analysis because of the small number of subjects.
The source of the code snippets is also available but not used in this analysis.
Is the data believable?
The subjects were not given any instructions on how to rate the code snippets for readability. Also we don’t know what outcome they were trying to achieve when rating, e.g., where they rating on the basis of how readable they personally found the snippets to be, or rating on the basis of the answer they would expect to give if they were being tested in an exam.
The subjects were students who are learning about software development and many of them are unlikely to have had any significant development experience outside of the teaching environment. Experience shows that students vary significantly in their ability to read and write source code and a non-trivial percentage do not go on to become software developers.
Because the subjects are at an early stage of learning about code it is to be expected that their opinions about readability will change while they are rating the 100 snippets. The study did not include multiple copies of some snippets, this would have enabled the consistency of individual subject responses to be estimated.
The results of many studies <book Annett_02> has shown that most subject ratings are based on an ordinal scale (i.e., there is no fixed relationship between the difference between a rating of 2 and 3 and a rating of 3 and 4), that some subjects are be overly generous or miserly in their rating and that without strict rating guidelines different subjects apply different criteria when making their judgements (which can result a subject providing a list of ratings that is inconsistent with every other subject).
Readability is one of those terms that developers use without having much idea what they and others are really referring to. The data from this study can at most be regarded as treating readability to be whatever each subject judges it to be.
Predictions made in advance
Is the readability rating given to code snippets consistent between different students on a computer science course?
The hypothesis is that the between student consistency of the readability rating given to code snippets improves as students progress through the years of attending computer science courses.
Applicable techniques
There are a variety of techniques for estimating rater agreement. <Krippendorff’s alpha> can be applied to ordinal ratings given by two or more raters and is used here.
Subjects do not have to give the same rating to share some degree of consistent response. Two subjects may share a similar pattern of increasing/decreasing/stay the same ratings across snippets. The <Spearman rank correlation> coefficient can be used to measure the correlation between the rank (i.e., relative value within sequence) of two sequences.
Results
When creating the snippets the researchers had no method of estimating what rating subjects would give to them and so there is no reason to expect a uniform distribution of rating values or any other kind of distribution of rating values.
The figure below is a boxplot of the rating of the first 50 code snippets rated by second year students and suggests that many subject ratings are within ±1 of each other.
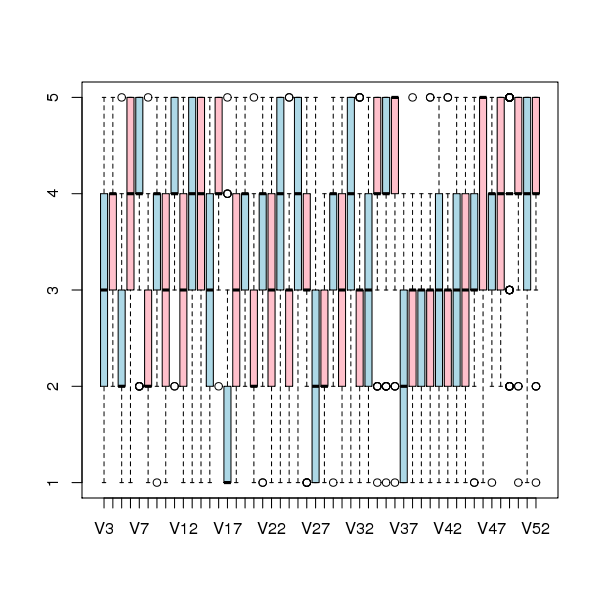
Figure 1. Boxplot of ratings given to snippets 1 to 50 by second year students (colors used to help distinguish boxplots for each snippet).
Between subject rating agreement
The Krippendorff alpha and mean Spearman rank correlation coefficient (the coefficient is calculated for every pair of subjects and the mean value taken) was obtained using the kripp.alpha and meanrho functions from the irr package (a <Jackknife> was used to obtain the following 95% confidence bounds):
Krippendorff's alpha cs1: 0.1225897 0.1483692 cs2: 0.2768906 0.2865904 cs4: 0.3245399 0.3405599 mean Spearman's rho cs1: 0.1844359 0.2167592 cs2: 0.3305273 0.3406769 cs4: 0.3651752 0.3813630 |
Taken as a whole there is a little of agreement. Perhaps there is greater consensus on the readability rating for a subset of the snippets. Recalculating using only using those snippets whose rated readability across all subjects, by year, has a standard deviation less than 1 (around 22, 51 and 62% of snippets respectively) shows some improvement in agreement:
Krippendorff's alpha cs1: 0.2139179 0.2493418 cs2: 0.3706919 0.3826060 cs4: 0.4386240 0.4542783 mean Spearman's rho cs1: 0.3033275 0.3485862 cs2: 0.4312944 0.4443740 cs4: 0.4868830 0.5034737 |
Between years comparison of ratings
The ratings from individual subjects is only available for one of their years at University. Aggregating the answers from all subjects in each year is one method of obtaining readability information that can be used to compare the opinions of students in different years.
How can subject ratings be aggregated to rank the 100 code snippets in order of what a combined group consider to be readability? The relatively large variation in mean value of the snippet ratings across subjects would result in wide confidence bounds for an aggregate based on ratings. Mapping each subject’s rating to a ranking removes the uncertainty caused by differences in mean subject ratings.
With 100 snippets assigned a rating between 1 and 5 by each subject there are going to be a lot of tied rankings. If, say, a subject gave 10 snippets a rating of 5 the procedure used is to assign them all the rank that is the mean of the ranks the 10 of them would have occupied if their ratings had been very slightly different, i.e., (1+2+3+4+5+6+7+8+9+10)/10 = 5.5. This process maps each students readability ratings to readability rankings, the next step is to aggregate these individual rankings.
The R_package[RankAggreg] package contains a variety of functions for aggregating a collection rankings to obtain a group ranking. However, these functions use the relative order of items in a vector to denote rank, and this form of data representations prevents them supporting ranked lists containing items having the same rank.
For this analysis a simple aggregate ranking algorithm using Borda’s method <book lin_10> was implemented. Borda’s method for creating an aggregate ranking operates on one item at a time, combining all of the subject ranks for that item into a single rank. Methods for combining ranks include taking their mean, their geometric mean and the square-root of the sum of their squares; the mean value was used for this analysis.
An aggregate ranking was created for subjects in years one, two and four and the plot below compares the ranking between 1st/2nd year students (left) and 2nd/4th year students (right). The order of the second year student snippet rankings have been sorted and the other year rankings for the snippets mapped to the corresponding position.
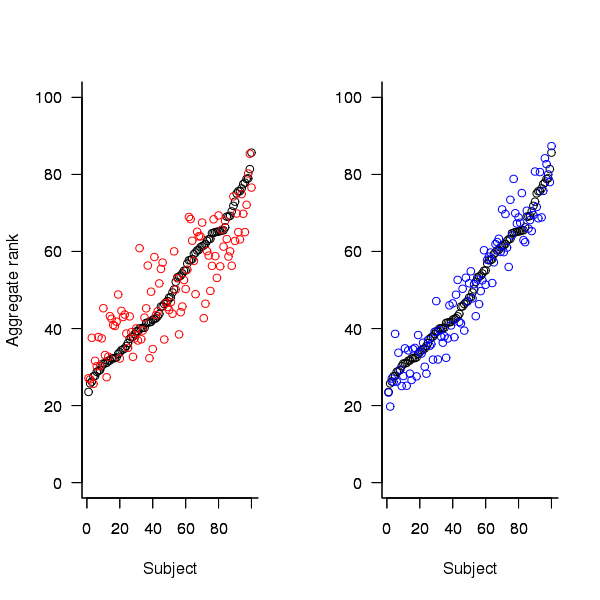
Figure 2. Aggregated ranking of snippets by subjects in years 1 and 2 (red and black) and years 2 and 4 (black and blue). Snippets have been sorted by year 2 ranking.
The above plot seems to show that at the aggregated year level there is much greater agreement between the 2nd/4th years than any other year pairing and measuring the correlation between each of the years using <Kendall’s tau>:
cs1.tau cs2.tau cs3.tau 0.6627602 0.6337914 0.8199636 |
confirms the greater agreement between this aggregate year pair.
Individual subject correlation to year aggregate ranking
To what extend to subject ratings correlate with their corresponding year aggregate? The following plot gives the correlation, using Kendall’s tau, between each subject and their corresponding year aggregate ranking.
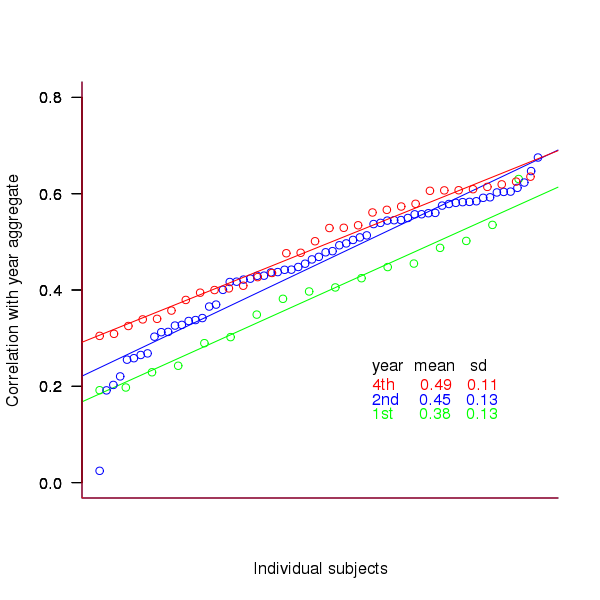
Figure 3. Correlation, using Kendall’s tau, between each subject and their corresponding year aggregate ranking.
The least squares fit shows that the variation in correlation across subjects in any year is very similar (removal of outliers in year 2 would make the lines almost parallel); the mean again shows a correlation that increases with year.
Discussion
The extent to which this study’s calculated values of rater agreement and correlation are considered worthy of further attention depends on the use to which the results will be put.
- From the perspective of trained raters the subject agreement in this study is very low and the rating have no further use.
- From the research perspective the results show that the concept of readability in the computer science student population has some non-zero substance to it that might be worth further study.
- From an overall perspective this study provides empirical evidence for a general lack of consensus on what constitutes readability.
It is not surprising that there is little agreement between student subjects on their readability rating, they are unlikely to have had much experience reading code and have not had any training in rating code for readability.
Professional developers will have spent years working with code and this experience is likely to have resulted in the creation of stable opinions on code readability. While developers usually work with code that is much longer than the few lines contained in the snippets used by Buse and Weimer, this experiment format is easy to administer and supports a fine level of control, i.e., allows a small set of source attributes of interest to be presented while excluding those not of interest. Repeating this study using such people as subjects would show whether this experience results in convergence to general agreement on the readability rating of code.
Summary of findings
The agreement between students readability ratings, for short snippets of code, improves as the students progress through course years 1 to 4 of a computer science degree.
While there is very good aggregated group agreement on the relative ranking of the readability of code snippets there is very little agreement between pairs of individuals.
- Two students chosen at random from within a year will have a low Spearman rank correlation coefficient for their rating of code snippet readability.
- Taken as a yearly aggregate there is a high degree of agreement between years two and four and less, but still good agreement between year 1 and other years.
- There is a broad range of correlations, from poor to good, between year aggregates and student subjects in the corresponding year.
Readability: we know nothing
Readability is one of those terms that developers use and expect other developers to understand while at the same time being unable to define what it is or how it might be measured. I think all developers would agree that their own code is very readable; if only different developers stopped writing code in different ways the issue would go away 🙂
Having written a book containing lots of material on cognitive psychology and how it might apply to programming, developers who have advanced beyond “Write code like me and it will be readable” sometimes ask for my perceived expert view on the subject. Unfortunately my expertise has only advanced to the stage of: 1) having a good idea of what research questions need to be addressed, 2) being able to point at experimental results showing that most claimed good readability tips are at best worthless or may even increase cognitive load during reading.
To a good approximation we know nothing about code readability. What questions need to answered to change this situation?
The first and most important readability question is: what is the purpose of looking at the code? Is the code being read to gain understanding (likely to involve ‘slow’ and deliberate behavior) or is the reader searching for some construct (likely to involve skimming; yes, slow and deliberate is more accurate but people make cost/benefit decisions when deciding which strategies to use. The factors involved in reader strategy selection is another important question)?
Next we need to ask what characteristics of developer performance are expected to change with different code organization/layouts. Are we interested in minimizing error, minimizing the time taken to achieve the readers purpose or something else?
What source code attributes play a significant role in readability? Possibilities include the order in which various constructs appear (e.g., should variable definitions appear at the start of a function or close to where they are first used), variable names and the position of tokens relative to each other when viewed by the reader.
Questions involving the relative position of tokens probably generates the greatest volume of discussion among developers. To what extent does visual organization of source code affect reader performance? Fluent reading requires a significant amount of practice, perhaps readable code is whatever developers have spent lots of time reading.
If there is some characteristic of the human visual system that generates a worthwhile benefit to splitting long lines so that a binary operator appears at the {end of the last}/{start of the next} line, will it apply the same way to all developers? We could end up developers having to configure their editor so it displays code in a form that matches the characteristics of their visual system.
How might these ‘visual’ questions be answered? I think that eye tracking will play a large role (“Eyetracking Web Usability” by Jakob Nielsen and Kara Pernice is a good read). At the moment there are technical/usability issues that make this kind of research very difficult. Eye trackers capable of continuously supporting enough resolution to know which character on the screen a developer is looking at (e.g., EyeLink 1000) require that the head be held in a fixed position, while those allowing completely free head movement (e.g., S2 Eye Tracker) don’t yet continuously support the required resolution.
Of course any theory derived from eye tracking experiments will still have to be validated by measuring developer performance on various code snippets.
Christmas book for 2010
I’m rather late with my list of Christmas books for 2010. While I do have a huge stack of books waiting to be read I don’t seem to have read many books this year (I have been reading lots of rather technical blogs this year, i.e., time/thought consuming ones) and there is only one book I would strongly recommend.
Anybody with even the slightest of interest in code readability needs to read
Reading in the Brain by Stanislaw Dehaene (the guy who wrote The Number Sense, another highly recommended book). The style of the book is half way between being populist and being an undergraduate text.
Most of the discussion centers around the hardware/software processing that takes place in what Dehaene refers to as the letterbox area of the brain (in the left occipito-temporal cortex). The hardware being neurons in the human brain and software being the connections between them (part genetically hardwired and part selectively learned as the brain’s owner goes through childhood; Dehaene is not a software developer and does not use this hardware/software metaphor).
As any engineer knows, knowledge of the functional characteristics of a system are essential when designing other systems to work with it. Reading this book will help people separate out the plausible from the functionally implausible in discussions about code readability.
Time and again the reading process has co-opted brain functionality that appears to have been designed to perform other activities. During the evolution of writing there also seems to have been some adaptation to existing processes in the brain; a lesson here for people designing code visualizations tools.
In my C book I tried to provide an overview of the reading process but skipped discussing what went on in the brain, partly through ignorance on my part and also a belief that we were a long way from having an accurate model. Dehaene’s book clearly shows that a good model of what goes on in the brain during reading is now available.
Information content of expressions
Software developers read source code to obtain information. How might the information content of source code be quantified?
Both of the following functions assign the same value to x and if that is the only information a reader of that code is interested in, then the information content of both assignment statements could be said to be the same.
int foo(void) { x = 5; ... } int bar(void) { x = 2 + 3; ... |
A reader seeking deeper understanding of the above code would ask why the value 5 is built from two values in bar. One reason might be that the author of the function wanted to explicitly call out background information about how the value 5 was derived (this is often done using symbolic names, but the use of literals themselves is sometimes encountered). Perhaps the author of foo did not see the need to expose this information or perhaps the shared value is purely coincidental.
If the two representations denote the same quantity doesn’t the second have a greater information content for a reader seeking deeper understanding?
In the following example:
... x + y & z ... ... ... num_red + num_white & lower_bits ... |
an experienced developer with a knowledge of English is likely to interpret the expression as adding the number of occurrences of two quantities and using bit-wise AND to extract the lower bits. For some readers the second expression has a higher information content. Would use of the names number_of_red further increase the information content?
In the following example the first expression has not added any information that was not already present in the first expression above (except perhaps that the author was not certain of the precedence or perhaps did not expect subsequent readers to be certain).
... ( x + y ) & z ... ... ... x + ( y & z ) ... |
The second expression uses parenthesis to achieve an operand/operator binding that is different from the default. Has this changed the information content of the expression?
There is experimental evidence that developers extract information from the names of variables to help them make decisions about operator precedence. To me the name all_32_bits_one suggests a sequence of bits and I would expect such a representation to be associated with the bit-wise AND operator, not binary plus. With no knowledge of the relative precedence of the two operators in the following expression the name of the middle operand would cause me to misinterpret the code. Does this change the information content of the expression? Does knowledge of the experimental evidence and the correct operator precedence change the information content (i.e., there is a potential fault in the code because the author may have assumed the incorrect precedence)?
... num_red + all_32_bits_one & sign_bit ... |
There is experimental evidence that people use the amount of whitespace appearing between operands and their operators to visually highlight operator precedence
The relative quantities of whitespace used in the following two expressions appear to tell very different stories. Do the two expressions have a different information content?
... x + y & z ... ... ... x + y & z ... |
The idea of measuring the information content of source code is very enticing. However, an accurate measure requires knowledge of the kind of information a reader is trying to obtain and of information that already exists in their brain.
Another question is the easy with which information can be extracted from code. Something that might be labeled as readability, except that readability has connotations of there being an abundant supply of information to extract.
Readability, an experimental view
Readability is an attribute that source code is often claimed to have, but what is it? While people are happy to use the term they have great difficulty in defining exactly what it is (I will eventually get around discussing my own own views in post). Ray Buse took a very simply approach to answering this question, he asked lots of people (to be exact 120 students) to rate short snippets of code and analysed the results. Like all good researchers he made his data available to others. This posting discusses my thoughts on the expected results and some analysis of the results.
The subjects were first, second, third year undergraduates and postgraduates. I would not expect first year students to know anything and for their results to be essentially random. Over the years, as they gain more experience, I would expect individual views on what constitutes readability to stabilize. The input from friends, teachers, books and web pages might be expected to create some degree of agreement between different students’ view of what constitutes readability. I’m not saying that this common view is correct or bears any relationship to views held by other groups of people, only that there might be some degree of convergence within a group of people studying together.
Readability is not something that students can be expected to have explicitly studied (I’m assuming that it plays an insignificant part in any course marks), so their knowledge of it is implicit. Some students will enjoy writing code and spends lots of time doing it while (many) others will not.
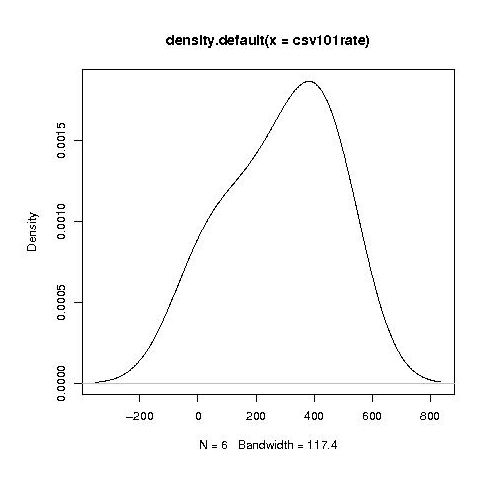
Separating out the data by year the results for first year students look like a normal distribution with a slight bulge on one side (created using plot(density(1_to_5_rating_data)) in R).
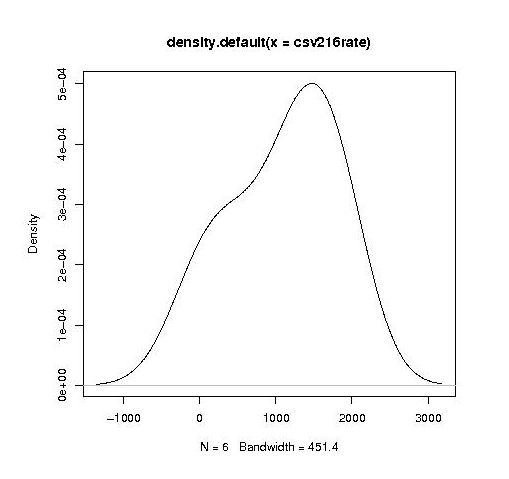
year by year this bulge turns (second year):
into a hillock (final year):
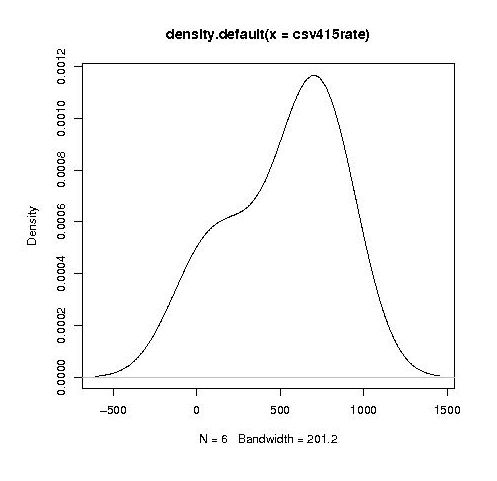
It is tempting to interpret these results as the majority of students assigning an essentially random rating, with a slight positive bias, for the readability of each snippet, with a growing number of more experienced students assigning less than average rating to some snippets.
Do the student’s view converge to a common opinion on readability? The answers appears to be No. An analysis of the final year data using Fleiss’s Kappa shows that there is virtually no agreement between students ratings. In fact every Interrater Reliability and Agreement function I tried said the same thing. Some cluster analysis might enable me to locate students holding similar views.
In an email exchange with Ray Buse I learned that the postgraduate students had a relatively wide range of computing expertise, so I did not analyse their results.
I wish I had thought of this approach to measuring readability. Its simplicity makes it amenable for use in a wide range of experimental situations. The one change I would make is that I would explicitly create the snippets to have certain properties, rather than randomly extracting them from existing source.
Recent Comments