Archive
Computer: Plot the data
Last Saturday I attended my first 24-hour hackathon in over 5-years (as far as I know, also the first 24-hour hackathon in London since COVID); the GenAI Hackathon.
I had a great idea for the tool to build. Readers will be familiar with the scene in sci-fi films where somebody says “Computer: Plot the data”, and a plot appears on the appropriate screen. I planned to implement this plot-the-data app using LLMs.
The easy option is to use speech to text, using something like OpenAI’s Whisper, as a front-end to a conventional plotting program. The hard option is to also use an LLM to generate the code needed to create the plot; I planned to do it the hard way.
My plan was to structure the internal functionality using langchain tools and agents. langchain can generate Python and execute this code.
I decided to get the plotting working first, and then add support for speech input. With six lines of Python I created a program that works every now and again; here is the code (which assumes that the environment variable OPENAI_API_KEY has been set to a valid OpenAI API key; the function create_csv_agent is provided by langchain):
from langchain.agents import create_csv_agent from langchain.llms import OpenAI import pandas agent = create_csv_agent(OpenAI(temperature=0.0, verbose=True), "aug-oct_day_items.csv", verbose=True) agent.run("Plot the Aug column against Oct column.") |
Sometimes this program figures out that it needs to call matplotlib to display the data, sometimes its output is a set of instructions for how this plot functionality could be implemented, sometimes multiple plots appear (with lines connecting points, and/or a scatter plot).
Like me, and others, readers who have scratched the surface of LLMs have read that setting the argument temperature=0.0 ensures that the output is always the same. In theory this is true, but in practice the implementation of LLMs contains some intrinsic non-determinism.
The behavior can be made more consistent by giving explicit instructions (just like dealing with humans). I prefixed the user input instructions to use matplotlib, use column names as the axis labels, and to generate a scatter plot, finally a request to display the plot is appended.
In the following code, the first call to plot_data specifies the ‘two month columns’, and the appropriate columns are selected from the csv file.
from langchain.agents import create_csv_agent from langchain.llms import OpenAI import pandas def plot_data(file_str, usr_str): agent = create_csv_agent(OpenAI(temperature=0.0, model_name="text-davinci-003", verbose=True), file_str, verbose=True) plot_txt="Use matplotlib to plot data and" +\ " use the column names for axis labels." +\ " I want you to create a scatter " +\ usr_str + " Display the plot." agent.run(plot_txt) plot_data("aug-oct_day_items.csv", "plot using the two month columns.") plot_data("task-est-act.csv", "plot using the estimates and actuals.") plot_data("task-est-act.csv", "plot the estimates and actuals using a logarithmic scale.") |
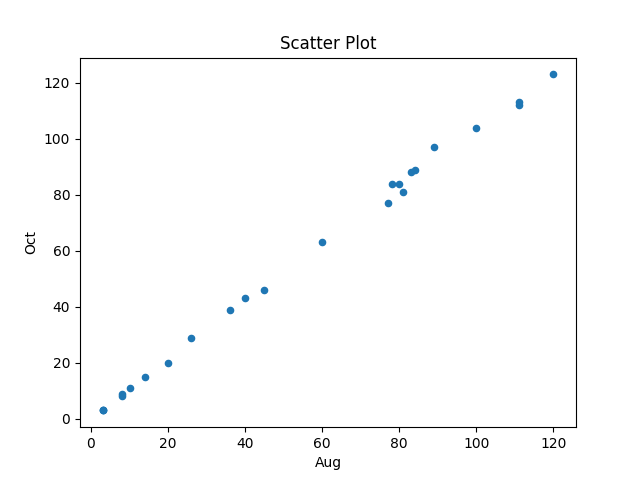
The first call to plot_data worked as expected, producing the following plot (code+data):
The second call failed with an ‘internal’ error. The generated Python has incorrect indentation:
IndentationError: unexpected indent (<unknown>, line 2) I need to make sure I have the correct indentation. |
While the langchain agent states what it needs to do to correct the error, it repeats the same mistake several times before giving up.
Like a well-trained developer, I set about trying different options (e.g., changing the language model) and searching various question/answer sites. No luck.
Finally, I broke with software developer behavior and added the line “Use the same indentation for each python statement.” to the prompt. Prompt engineering behavior is to explicitly tell the LLM what to do, not to fiddle with configuration options.
So now the second call to plot_data works, and the third call sometimes does odd things.
At the hack I failed to convince anybody else to work on this project with me. So I joined another project and helped out (they were very competent and did not really need my help), while fiddling with the Plot-the-data idea.
The code+test data is in the Plot-the-data Github repo. Pull requests welcome.
A Wikihouse hackathon
I was at the Wikihouse hackathon on Wednesday. Wikihouse is an open-source project involving prefabricated house designs and building processes.
Why is a software guy attending what looks like a very non-software event? The event organizers listed software developer as one of the attendee skill sets. Also, I have been following the blog Construction Physics, where Brian Potter has been trying to work out why the efficiency of building construction has not significantly improved over many decades; the approach is wide-ranging, data driven and has parallels with my analysis of software engineering. I counted four software people at the event, out of 30’ish attendees; Sidd I knew from previous hacks.
Building construction shares some characteristics with software development. In particular, projects are bespoke, but constructed using subcomponents that are variations on those used in most other projects of the same kind of building, e.g., walls±window frames, floors/ceilings.
The Wikihouse design and build process is based around a collection of standardised, prefabricated subcomponents, called blocks; these are made from plywood, slotted together, and held in place using butterfly/bow-tie joints (wood has a negative carbon footprint). A library of blocks is available, with the page for each block including a DXF cutting file, assembly manual, 3-D model, and costing; there is a design kit for building a house, including a spreadsheet for costing, and a variety of How-Tos. All this is available under an open source license. The Open Systems Lab is implementing building design software and turning planning codes into code.
Not knowing anything about building construction, I have no way of judging the claims made during the hackathon introductory presentations, e.g., cost savings, speed of build, strength of building, expected lifetime, etc.
Constructing lots of buildings using Wikihouse blocks could produce an interesting dataset (provided those doing the construction take the time to record things). Questions such as: how does construction time vary by team composition (self-build is possible) and experience, and by number of rooms and their size spring to mind (no construction time/team data was recorded during the construction of the ‘beta test’ buildings).
The morning was taken up with what was essentially a product pitch, then we got shown around the ‘beta test’ buildings (they feel bigger on the inside), lunch and finally a few hours hacking. The help they wanted from software people was in connecting together some of the data/tools they had created, but with only a few hours available there was little that could be done (my input was some suggestions on construction learning curves and a few people/groups I knew doing construction data analysis)
Will an open source approach enable the Wikihouse project to succeed with its prefabricated approach to building construction, where closed source companies have failed when using this approach, e.g., Katerra?
Part of the reason that open source software succeeded was that it provided good enough functionality to startup projects/companies who could not afford to pay for software (in some cases the open source tools provided superior functionality). Some of these companies grew to be significant players, convincing others that open source was viable for production work. Source code availability allows developers to use it without needing to involve management, and plenty of managers have been surprised to find out how embedded open source software is within their group/organization.
Buildings are not like software, lots of people with some kind of power notice when a new building appears. Buildings need to be connected to services such as water, gas and electricity, and they have a rateable value which the local council is keen to collect. Land is needed to build on, and there are a whole host of permissions and certificates that need to be obtained before starting to build and eventually moving in. Doing it, and telling people later is not an option, at least in the UK.
Finding patterns in construction project drawing creation dates
I took part in Projecting Success‘s 13th hackathon last Thursday and Friday, at CodeNode (host to many weekend hackathons and meetups); around 200 people turned up for the first day. Team Designing-Success included Imogen, Ryan, Dillan, Mo, Zeshan (all building construction domain experts) and yours truly (a data analysis monkey who knows nothing about construction).
One of the challenges came with lots of real multi-million pound building construction project data (two csv files containing 60K+ rows and one containing 15K+ rows), provided by SISK. The data contained information on project construction drawings and RFIs (request for information) from 97 projects.
The construction industry is years ahead of the software industry in terms of collecting data, in that lots of companies actually collect data (for some, accumulate might be a better description) rather than not collecting/accumulating data. While they have data, they don’t seem to be making good use of it (so I am told).
Nearly all the discussions I have had with domain experts about the patterns found in their data have been iterative, brief email exchanges, sometimes running over many months. In this hack, everybody involved is sitting around the same table for two days, i.e., the conversation is happening in real-time and there is a cut-off time for delivery of results.
I got the impression that my fellow team-mates were new to this kind of data analysis, which is my usual experience when discussing patterns recently found in data. My standard approach is to start highlighting visual patterns present in the data (e.g., plot foo against bar), and hope that somebody says “That’s interesting” or suggests potentially more interesting items to plot.
After several dead-end iterations (i.e., plots that failed to invoke a “that’s interesting” response), drawings created per day against project duration (as a percentage of known duration) turned out to be of great interest to the domain experts.
Building construction uses a waterfall process; all the drawings (i.e., a kind of detailed requirements) are supposed to be created at the beginning of the project.
Hmm, many individual project drawing plots were showing quite a few drawings being created close to the end of the project. How could this be? It turns out that there are lots of different reasons for creating a drawing (74 reasons in the data), and that it is to be expected that some kinds of drawings are likely to be created late in the day, e.g., specific landscaping details. The 74 reasons were mapped to three drawing categories (As built, Construction, and Design Development), then project drawings were recounted and plotted in three colors (see below).
The domain experts (i.e., everybody except me) enjoyed themselves interpreting these plots. I nodded sagely, and occasionally blew my cover by asking about an acronym that everybody in the construction obviously knew.
The project meta-data includes a measure of project performance (a value between one and five, derived from profitability and other confidential values) and type of business contract (a value between one and four). The data from the 97 projects was combined by performance and contract to give 20 aggregated plots. The evolution of the number of drawings created per day might vary by contract, and the hypothesis was that projects at different performance levels would exhibit undesirable patterns in the evolution of the number of drawings created.
The plots below contain patterns in the quantity of drawings created by percentage of project completion, that are: (left) considered a good project for contract type 1 (level 5 are best performing projects), and (right) considered a bad project for contract type 1 (level 1 is the worst performing project). Contact the domain experts for details (code+data):
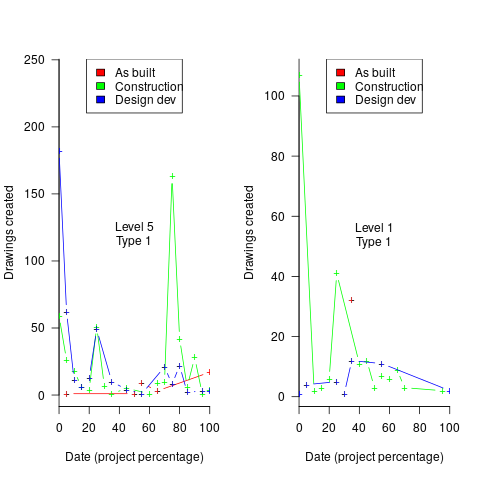
The path to the above plot is a common one: discover an interesting pattern in data, notice that something does not look right, use domain knowledge to refine the data analysis (e.g., kinds of drawing or contract), rinse and repeat.
My particular interest is using data to understand software engineering processes. How do these patterns in construction drawings compare with patterns in the software project equivalents, e.g., detailed requirements?
I am not aware of any detailed public data on requirements produced using a waterfall process. So the answer is, I don’t know; but the rationales I heard for the various kinds of drawings sound as-if they would have equivalents in the software requirements world.
What about the other data provided by the challenge sponsor?
I plotted various quantities for the RFI data, but there wasn’t any “that’s interesting” response from the domain experts. Perhaps the genius behind the plot ideas will be recognized later, or perhaps one of the domain experts will suddenly realize what patterns should be present in RFI data on high performance projects (nobody is allowed to consider the possibility that the data has no practical use). It can take time for the consequences of data analysis to sink in, or for new ideas to surface, which is why I am happy for analysis conversations to stretch out over time. Our presentation deck included some RFI plots because there was RFI data in the challenge.
What is the software equivalent of construction RFIs? Perhaps issues in a tracking system, or Jira tickets? I did not think to talk more about RFIs with the domain experts.
How did team Designing-Success do?
In most hackathons, the teams that stay the course present at the end of the hack. For these ProjectHacks, submission deadline is the following day; the judging is all done later, electronically, based on the submitted slide deck and video presentation. The end of this hack was something of an anti-climax.
Did team Designing-Success discover anything of practical use?
I think that finding patterns in the drawing data converted the domain experts from a theoretical to a practical understanding that it was possible to extract interesting patterns from construction data. They each said that they planned to attend the next hack (in about four months), and I suggested that they try to bring some of their own data.
Can these drawing creation patterns be used to help monitor project performance, as it progressed? The domain experts thought so. I suspect that the users of these patterns will be those not closely associated with a project (those close to a project are usually well aware of that fact that things are not going well).
Team DNA-impersonators create a business plan
This weekend I was at the Hack the Police hackthon, sponsored by the Metropolitan Police+other organizations. My plan was to find an interesting problem to help solve, using the data we were told would be available. My previous experience with crime data is that there is not enough of it to allow reliable models to be built, this is a good thing in that nobody wants lots of crime. Talking to a Police intelligence officer, the publicly available data contained crimes (i.e., a court case had found somebody guilty), not reported incidents, and was not large enough to build allow a good model to be built.
Looking for a team to join, I got talking to Joe and Rebecca. Joe had discovered a very interesting possible threat to the existing DNA matching technique, and they were happy for me to join them analyzing this threat model; team DNA-impersonators was go.
Some background (Joe and Rebecca are the team’s genetic experts, I’m a software guy who has read a few books on the subject; all the mistakes in this post are mine). The DNA matching technique used by the Police is based on 17 specific sequences (each around 100 bases, known as loci), within the human genome (which contains around 3 billion bases).
There are companies who synthesize sequences of DNA to order. I knew that machines for doing this existed, but I did not know it was possible to order a bespoke sequence online, and how inexpensive it was.
Some people have had their DNA sequenced, and have allowed it to be published online; Steven Pinker is the most famous person I could find, whose DNA sequence is available online (link not given; it requires work+luck to find). The Personal Genome Projects aims to sequence and make available the complete genomes of 100,000 volunteers (the UK arm of this project is on hold because of lack of funding; master criminals in the UK have a window of opportunity: offer to sponsor the project on condition that their DNA is included in the public data set).
How much would it cost to manufacture bottles of spray-on Steven Pinker DNA? Is there a viable business model selling Pinker No. 5?
The screen shot below shows a quote for 2-nmol of DNA for the sequence of 100 bases that are one of the 17 loci used in DNA matching. This order is for concentrated DNA, and needs to be diluted to the level likely to be found as residue at a crime scene. Joe calculated that 2-nmol can be diluted to produce 60-liters of usable ‘product’.
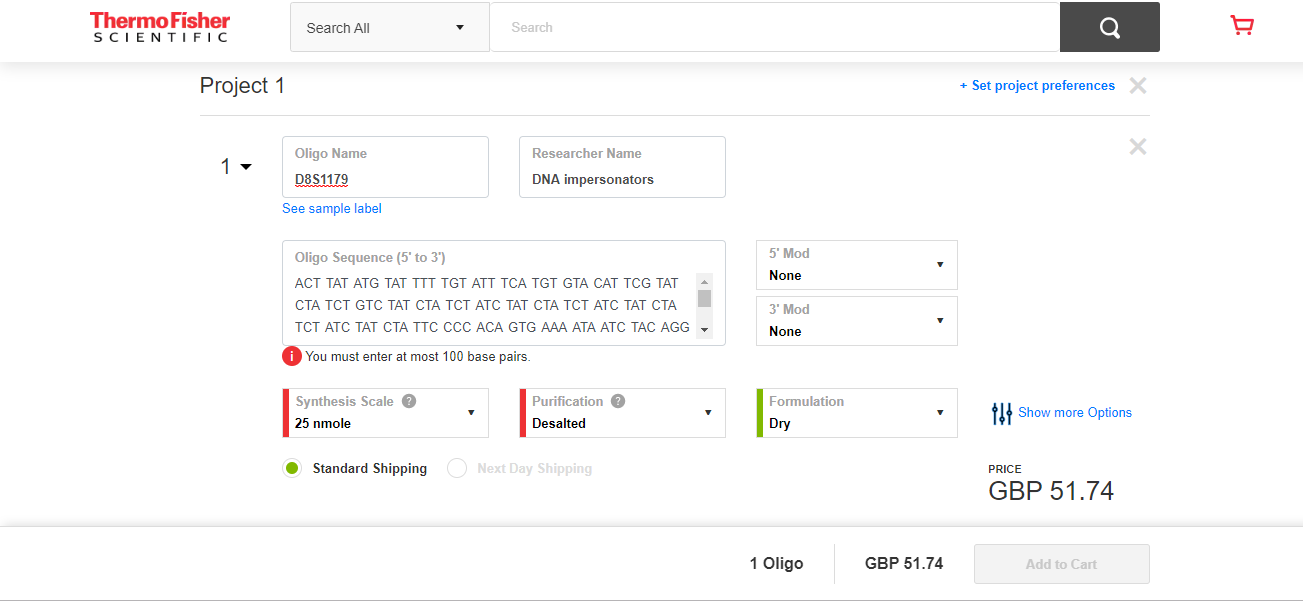
There was not enough time to obtain sequences for the other 16-loci, and get quotes for them. Information on the 17-loci used for DNA matching is available in research papers; a summer job for a PhD student to sort out the details.
The concentrate from the 17-loci dilutes to 60-liters. Say each spray-on bottle contains 100ml, then an investment of £800 (plus researcher time) generates enough liquid for 600-bottles of Pinker No. 5.
What is the pricing model? Is there a mass market (e.g., Hong Kong protesters wanting to be anonymous), or would it be more profitable to target a few select clients? Perhaps Steven Pinker always wanted to try his hand at safe-cracking in his spare time, but was worried about leaving DNA evidence behind; he might be willing to pay to have the market flooded, so Pinker No. 5 residue becomes a common occurrence at crime scenes (allowing him to plausible claim that any crime scene DNA matches were left behind by other people).
Some of the police officers at the hack volunteered that they knew lots of potential customers; the forensics officer present was horrified.
Before the 1980s, DNA profiling was not available. Will the 2020s be the decade in which DNA profiling ceases being a viable tool for catching competent criminals?
High quality photocopiers manufacturers are required to implement features that make it difficult for people to create good quality copies of paper currency.
What might law enforcement do about this threat to the viability of DNA profiling?
Ideas include:
- Requiring companies in the bespoke DNA business to report suspicious orders. What is a suspicious order? Are enough companies in business to make it possible to order each of the 17-loci from different company (we think so)?
- Introducing laws making it illegal to be in possession of diluted forms of other people’s DNA (with provisions for legitimate uses).
- Attacking the economics of the Pinker No. 5 business model by having more than 17-loci available for use in DNA matching. Perhaps 1,000 loci could be selected as potential match sites, with individual DNA testing kits randomly testing 17 (or more) from this set.
A zero-knowledge proofs workshop
I was at the Zero-Knowledge proofs workshop run by BinaryDistict on Monday and Tuesday. The workshop runs all week, but is mostly hacking for the remaining days (hacking would be interesting if I had a problem to code, more about this at the end).
Zero-knowledge proofs allow person A to convince person B, that A knows the value of x, without revealing the value of x. There are two kinds of zero-knowledge proofs: an interacting proof system involves a sequence of messages being exchanged between the two parties, and in non-interactive systems (the primary focus of the workshop), there is no interaction.
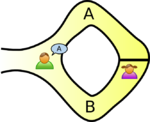
The example usually given, of a zero-knowledge proof, involves Peggy and Victor. Peggy wants to convince Victor that she knows how to unlock the door dividing a looping path through a tunnel in a cave.
The ‘proof’ involves Peggy walking, unseen by Victor, down path A or B (see diagram below; image from Wikipedia). Once Peggy is out of view, Victor randomly shouts out A or B; Peggy then has to walk out of the tunnel using the path Victor shouted; there is a 50% chance that Peggy happened to choose the path selected by Victor. The proof is iterative; at the end of each iteration, Victor’s uncertainty of Peggy’s claim of being able to open the door is reduced by 50%. Victor has to iterate until he is sufficiently satisfied that Peggy knows how to open the door.
As the name suggests, non-interactive proofs do not involve any message passing; in the common reference string model, a string of symbols, generated by person making the claim of knowledge, is encoded in such a way that it can be used by third-parties to verify the claim of knowledge. At the workshop we got an overview of zk-SNARKs (zero-knowledge succinct non-interactive argument of knowledge).
The ‘succinct’ component of zk-SNARK is what has made this approach practical. When non-interactive proofs were first proposed, the arguments of knowledge contained around one-terabyte of data; these days common reference strings are around a kilobyte.
The fact that zero-knowledge ‘proof’s are possible is very interesting, but do they have practical uses?
The hackathon aspect of the workshop was designed to address the practical use issue. The existing zero-knowledge proofs tend to involve the use of prime numbers, or the factors of very large numbers (as might be expected of a proof system that is heavily based on cryptographic techniques). Making use of zero-knowledge proofs requires mapping the problem to a form that has a known solution; this is very hard. Existing applications involve cryptography and block-chains (Zcash is a cryptocurrency that has an option that provides privacy via zero-knowledge proofs), both heavy users of number theory.
The workshop introduced us to two languages, which could be used for writing zero-knowledge applications; ZoKrates and snarky. The weekend before the workshop, I tried to install both languages: ZoKrates installed quickly and painlessly, while I could not get snarky installed (I was told that the first two hours of the snarky workshop were spent getting installs to work); I also noticed that ZoKrates had greater presence than snarky on the web, in the form of pages discussing the language. It seemed to me that ZoKrates was the market leader. The workshop presenters included people involved with both languages; Jacob Eberhardt (one of the people behind ZoKrates) gave a great presentation, and had good slides. Team ZoKrates is clearly the one to watch.
As an experienced hack attendee, I was ready with an interesting problem to solve. After I explained the problem to those opting to use ZoKrates, somebody suggested that oblivious transfer could be used to solve my problem (and indeed, 1-out-of-n oblivious transfer does offer the required functionality).
My problem was: Let’s say I have three software products, the customer has a copy of all three products, and is willing to pay the license fee to use one of these products. However, the customer does not want me to know which of the three products they are using. How can I send them a product specific license key, without knowing which product they are going to use? Oblivious transfer involves a sequence of message exchanges (each exchange involves three messages, one for each product) with the final exchange requiring that I send three messages, each containing a separate product key (one for each product); the customer can only successfully decode the product-specific message they had selected earlier in the process (decoding the other two messages produces random characters, i.e., no product key).
Like most hackathons, problem ideas were somewhat contrived (a few people wanted to delve further into the technical details). I could not find an interesting team to join, and left them to it for the rest of the week.
There were 50-60 people on the first day, and 30-40 on the second. Many of the people I spoke to were recent graduates, and half of the speakers were doing or had just completed PhDs; the field is completely new. If zero-knowledge proofs take off, decisions made over the next year or two by the people at this workshop will impact the path the field follows. Otherwise, nothing happens, and a bunch of people will have interesting memories about stuff they dabbled in, when young.
Publishing information on project progress: will it impact delivery?
Numbers for delivery date and cost estimates, for a software project, depend on who you ask (the same is probably true for other kinds of projects). The people actually doing the work are likely to have the most accurate information, but their estimates can still be wildly optimistic. The managers of the people doing the work have to plan (i.e., make worst/best case estimates) and deal with people outside the team (i.e., sell the project to those paying for it); planning requires knowledge of where things are and where they need to be, while selling requires being flexible with numbers.
A few weeks ago I was at a hackathon organized by the people behind the Project Data and Analytics meetup. The organizers (Martin Paver & co.) had obtained some very interesting project related data sets. I worked on the Australian ICT dashboard data.
The Australian ICT dashboard data was courtesy of the Queensland state government, which has a publicly available dashboard listing digital project expenditure; the Victorian state government also has a dashboard listing ICT expenditure. James Smith has been collecting this data on a monthly basis.
What information might meaningfully be extracted from monthly estimates of project delivery dates and costs?
If you were running one of these projects, and had to provide monthly figures, what strategy would you use to select the numbers? Obviously keep quiet about internal changes for as long as possible (today’s reduction can be used to offset a later increase, or vice versa). If the client requests changes which impact date/cost, then obviously update the numbers immediately; the answer to the question about why the numbers changed is that, “we are responding to client requests” (i.e., we would otherwise still be on track to meet the original end-points).
What is the intended purpose of publishing this information? Is it simply a case of the public getting fed up with overruns, with publishing monthly numbers is seen as a solution?
What impact could monthly publication have? Will clients think twice before requesting an enhancement, fearing public push back? Will companies doing the work make more reliable estimates, or work harder?
Project delivery dates/costs change because new functionality/work-to-do is discovered, because the appropriate staff could not be hired and other assorted unknown knowns and unknowns.
Who is looking at this data (apart from half a dozen people at a hackathon on the other side of the world)?
Data on specific projects can only be interpreted in the context of that project. There is some interesting research to be done on the impact of public availability on client and vendor reporting behavior.
Will publication have an impact on performance? One way to get some idea is to run an A/B experiment. Some projects have their data made public, others don’t. Wait a few years, and compare project performance for the two publication regimes.
A Python Data Science hackathon
I was at the Man AHL Hackathon this weekend. The theme was improving the Python Data Science ecosystem. Around 15, or so, project titles had been distributed around the tables in the Man AHL cafeteria and the lead person for each project gave a brief presentation. Stable laws in SciPy sounded interesting to me and their room location included comfy seating (avoiding a numb bum is an under appreciated aspect of choosing a hackathon team and wooden bench seating is not numbing after a while).
Team Stable laws consisted of Andrea, Rishabh, Toby and yours truly. Our aim was to implement the Stable distribution as a Python module, to be included in the next release of SciPy (the availability had been announced a while back and there has been one attempt at an implementation {which seems to contain a few mistakes}).
We were well-fed and watered by Man AHL, including fancy cream buns and late night sushi.
A probability distribution is stable if the result of linear combinations of the distribution has the same distribution; the Gaussian, or Normal, distribution is the most well-known stable distribution and the central limit theorem leads many to think, that is that.
Two other, named, stable distributions are the Cauchy distribution and most interestingly (from my perspective this weekend) the Lévy distribution. Both distributions have very fat tails; the mean and variance of the Cauchy distribution is undefined (i.e., the values jump around as the sample size increases, never converging to a fixed value), while they are both infinite for the Lévy distribution.
Analytic expressions exist for various characteristics of the Stable distribution (e.g., probability distribution function), with the Gaussian, Cauchy and Lévy distributions as special cases. While solutions for implementing these expressions have been proposed, care is required; the expressions are ill-behaved in different ways over some intervals of their parameter values.
Andrea has spent several years studying the Stable distribution analytically and was keen to create an implementation. My approach for complicated stuff is to find an existing implementation and adopt it. While everybody else worked their way through the copious papers that Andrea had brought along, I searched for existing implementations.
I found several implementations, but they all suffered from using approaches that delivered discontinuities and poor accuracies over some range of parameter values.
Eventually I got lucky and found a paper by Royuela-del-Val, Simmross-Wattenberg and Alberola-López, which described their implementation in C: Libstable (licensed under the GPL, perfect for SciPy); they also provided lots of replication material from their evaluation. An R package was available, but no Python support.
No other implementations were found. Team Stable laws decided to create a new implementation in Python and to create a Python module to interface to the C code in libstable (the bit I got to do). Two implementations would allow performance and accuracy to be compared (accuracy checks really need three implementations to get some idea of which might be incorrect, when output differs).
One small fix was needed to build libstable under OS X (change Makefile to link against .so library, rather than .a) and a different fix was needed to install the R package under OS X (R patch; Windows and generic Unix were fine).
Python’s ctypes module looked after loading the C shared library I built, along with converting the NumPy arrays. My PyStable module will not win any Python beauty contest, it is a means of supporting the comparison of multiple implementations.
Some progress was made towards creating a new implementation, more than 24 hours is obviously needed (libstable contains over 4,000 lines of code). I had my own problems with an exception being raised in calls to stable_pdf; libstable used the GNU Scientific Library and I tracked the problem down to a call into GSL, but did not get any further.
We all worked overnight, my first 24-hour hack in a very long time (I got about 4-hours sleep).
After Sunday lunch around 10 teams presented and after a quick deliberation, Team Stable laws were announced as the winners; yea!
Hopefully, over the coming weeks a usable implementation will come into being.
AEC hackathon: what do the coloured squiggles mean?
I was at the AEC hackathon last weekend. There were a whole host of sponsors, but there was talk of project sponsorship for teams trying to solve a problem involving London’s Crossrail project. So most of those present were tightly huddled around tables, intently whispering to each other about their crossrail hack (plenty of slide-ware during the presentations).
I arrived at hacker time (a bit later than all the keen folk who had been waiting outside for the doors to open from eight’ish) and missed out on forming a team. Talking to Nik and Geoff, from the Future Cities Catapult (one of the sponsors), I learned about the 15 sensor packages that had been distributed around the building we were in (Intel Photon+Smartcitizen sensor kits, connected via the local wifi).
These sensors had been registered with the Smart Citizen platform and various environmental measurements, around each sensor, was being recorded at 1 minute resolution. The sensors had been set up a few days earlier, so only recent data was available.

The Smart Citizen dashboard provided last recorded values and a historical plot for each sensor on its own (example here). The Future Cities guys wanted something a bit more powerful, and team Coloured Squiggles set to work (one full time member, plus anyone who dawdled within conversation range).
It did not take long, using R, to extract and plot the data from various sensors (code). The plot below shows just over a days worth of data from the sensor installed in the basement (where the hackathon took place). The red line is ambient light (which is all internal because we are underground), yellowish is sound level (the low level activity before the lights come on is air-conditioning switching on ready for Friday morning, there is no such activity for Saturday morning), blue is carbon monoxide (more about that later), green is nitrogen dioxide and purple is humidity. Values have been normalised.
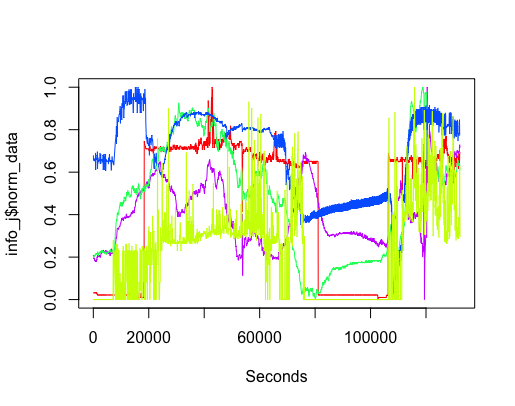
The interesting part of the project was interpreting the squiggly lines; what was making them go up and down. Nik was a great source of ideas and being involved with setting the sensors up knew about the kind of environment they were in, e.g., basement, by the window (a source of light) and on top of the coffee machine (which was on a fridge, whose cooling motor on/off cycling we eventually decided was causing the periodic nighttime spikes in the sound level seen in yellow below {ignore the x-axis values}).
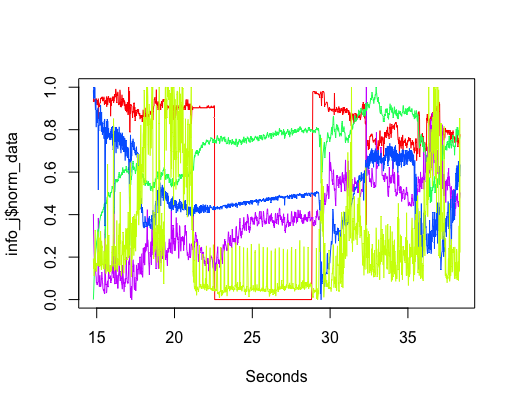
The variation in the level of Carbon-Monoxide was discussed a lot. IoT sensors are very low cost and so it is easy to question the quality of their output. However, all sensors showed this same pattern of behavior, although some contained more noise than others (compare the thickness of the blue lines in the above plots). One idea was that CO is heavier than air and sinks to the floor at night and gets stirred up in the morning, but Wikipedia says it is not heavier than air. Another idea was that the air-conditioning allows fresh outside into the building in the morning, which gets gradually gets filtered.
The lessons learned was that a sensor’s immediate environment can cause all sorts of unexpected variation in its output. The only way to figure out what is going on is by walking round talking to the people who occupy the same space as the sensor.
The final version provided a browser based interface, allowing individual devices and multiple sensor output to be selected (everything is on github).
Predicting the next value in an integer sequence
There was a Kaggle meetup group hackathon on Saturday. Integer sequence learning is a recently posted Kaggle challenge; build a model to predict the next value in an integer sequence, with example data coming from the On-Line Encyclopedia of Integer Sequences. How could I not want to try my hand at this challenge and I signed up for the hackathon hoping to find like-minded folk.
My only previous encounter with mining the OEIS was a paper that attempted to combine two or more existing sequences to match one existing sequence and to contribute a few sequences I had found.
The event was well attended and I found a fellow enthusiast in Lampros.
We kicked around a few ideas and while I jumped in and started investigating the characteristics of the data, Lampros started searching for solutions that others had found to the next value in an integer sequence problem (a much more sensible approach, but probably not as much fun as jumping in feet first; this was his first hackathon, so he has not picked up any bad habits yet ;-).
This is one of those few problems when over-fitting is required for things to work.
I concentrated on characterizing the 113,845 sequences in the training set and the following is a summary (code and data):
- 74,465 sequences contained a maximum value less than
 and 98,916 less than
  . So symbolic maths is going to be needed (a shame since I had found tscount, an R package for analyzing count time series),
 - a goodly 72,202 sequences are in sorted order, leaving 41,643 to go up and down,
- The least significant digit of the values in many sequences are a subset of the ten possible values. The following is a list of the number of unique least significant digits in the training sequences:
    1     2     3     4     5     6     7     8     9    10
 1289  4692  6800 11589 15773 13701  7635  8644 10837 32885
After removing sequences containing fewer than 20 values (the -1 count)
   -1     1     2     3     4     5     6     7     8     9    10
33398   764  3006  3171  6068  8930  7898  3690  5604  9073 32243
Lampros found Martin Rubey’s work on guessing formulas for sequences, which had an Open Source implementation using FriCAS (source code, which needs Steel Bank Common Lisp to build, which itself needs your OS to support 512 open files {OS X default is 256}).
Other software and papers include: the gfun package plus paper, sequence prediction in Mathematica and a Masters thesis on Inductive Inference of Integer Sequences.
These systems are all based on fitting a, potentially very complicated, polynomial to each sequence and achieve a success rate of around 20% on the complete OEIS.
What are the characteristics of the 80% for which a polynomial fit does not predict the next value? Perhaps there are not enough values specified in these sequence to fit the necessary polynomial. Perhaps the values grow at a faster rate than can be fitted by any polynomial expression, e.g., the Busy beaver function.
A 11:00-17:00 hackathon is not really enough time to get anything sensible up and running. People doing Masters projects had more hours and were managing to get around 20% correct.
The competition leaderboard currently has somebody with a score of 0.74. This is a big lead over everybody else. Am I being cynical by thinking the model might be reading the OEIS text to find the formula describing the sequence and then evaluating this?
Update
Comparing Computer Models Solving Number Series Problems provides an interesting review of systems using an AI based approach, i.e., trying to mimic what people do.
Hackathon New Year’s resolution
The problem with being a regularly hackathon attendee is needing a continual stream of interesting ideas for something to build; the idea has to be sold to others (working in a team of one is not what hackathons are about), be capable of being implemented in 24 hours (if only in the flimsiest of forms) and make use of something from one of the sponsors (they are paying for the food and drink and it would be rude to ignore them).
I think the best approach for selecting something to build is to have the idea and mold one of the supplied data sets/APIs/sponsor interests to fit it; looking at what is provided and trying to come up with something to build is just too hard (every now and again an interesting data set or problem pops up, but this is not a regular occurrence).
My resolution for next year is to only work on Wow projects at hackathons. This means that I will not be going to as many hackathons (because I cannot think of a Wow idea to build) and will be returning early from many that I attend (because my Wow idea gets shot down {a frustratingly regular occurrence} and nobody else manages to sell me their idea, or the data/API turns out to be seriously deficient {I’m getting better at spotting the likelihood of this happening before attending}).
Recent Comments