Archive
Estimating the yearly spend on developing software
How much does a software company spend on developing its software?
The plot below shows revenue vs software development costs for 100 US companies, in industry categories Computer programming services and Packaged software, with revenues greater than $100 million during 2014-2015. The data is from company accounts filed with the government (code+data, plus the Georgia Tech financial analysis lab where I found the data).
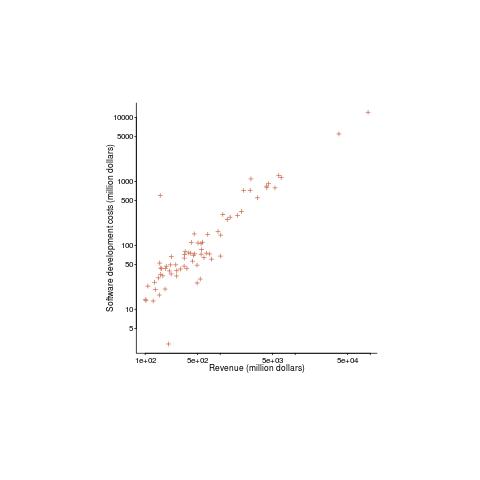
A straight line fits very well (a quadratic is slightly better, but let’s keep things simple) and shows companies spending 13% of their revenue on software development. A log-log graph suggests a power law, but in this case the fitted exponent is one, i.e., no power law as such.
If 13% is the figure for companies that would be expected to be spending heavily to develop software, how much do companies in other industry sectors pay? Google and Facebook are media companies (their income is from advertising), do they really spend that much on software?
There are an estimated 3.3 million software developers in the US. What is the average cost of a software developer? If we take an average salary of $80K, and do the usual doubling to factor in overheads, we get $160K. This gives a total software development cost (most of the cost is for people) in the US of around $0.5 trillion per year.
The above plot shows 1.6%0.6%6% of the estimated $0.5 trillion yearly software development costs in the US. Who is spending the other 98.4%99.4%94%? One place to look is the Form 10-K that public companies are required to submit to the Securities and Exchange Commission.
Facebook’s 10-K, for 2015, shows $4,816 million spent on R&D (is this all software?) and $3,633 million on “Computer software, office equipment and other” (I’m guessing almost none of this is capitalized software). Dividing R&D expenditure by number of employees (12,691 at the end of 2015) gives $380K. I know average Silicon valley salaries are high, but not that high. I have enough trouble following my own company’s accounts, so trying to understand Facebook’s is a lost cause before it starts.
Scraping the Form 10-K’s on the SEC site will not provide sensible numbers, they will have to be read and analyzed. There is enough material for several MBA projects…
NWIP for Monochrome inkjet yield
As a member of IST/5, the British Standards’ programming language committee, I receive a daily notification of relevant documents that have arrived at BSI. The email arrives just before midnight and contains a generous helping of acronyms, such as: N13344 SC 28 ISO-IECJTC1-SC28 N2051 NWIP for Monochrome inkjet yield.
The line break on the above line resulted in “Monochrome inkjet yield” appearing at the start of a line and it caught my attention, so I downloaded the document.
SC28 is the ISO committee for office equipment and this NWIP (New Work Item Proposal) is for WG2 (the Working Group responsible for consumables) to create a new ISO Standard with the title: “Method for the Determination of Ink Cartridge Yield for Monochrome Inkjet Printers and Multifunction Devices that Contain Printer Components”. Voting, on whether or not work should start on this proposal, closes on July 12.
Why was information about inkjet yield sent to a programming language list? Are SC28/WG2 having a membership drive and have been tipped off that our workload is declining? More importantly, are they following the C++ model of having regular meetings in Hawaii; the paperwork does not say. The standard for color injet printers appeared in 2009; was the production of this document such a traumatic event that it decimated committee membership and it has taken eight years to put together a skeleton group.
Attached to the proposal is a 20-page draft document; somebody has been busy.
So how is it proposed that monochrome inkjet yield be calculated? You need at least nine inkjet cartridges, three printers and a room at a temperature of 23 degrees (plus/minus 2 degrees, with readings taken every 15 minutes and an hourly running average calculated; “… temperature can have a profound effect on test results.”). Load “… a common medium weight paper and must conform to the printer’s list of approved papers.” into the three printers that have been “… temperature acclimated to the test room environment.” and count the number of pages printed by each printer (using at least three cartridges in each printer) before “…an end of life judgement.” Divide total number of pages printed by total number of cartridges used and there you go.
End of life? “The cartridge yield is determined by an end of life judgement, or signalled with either of two phenomena: fade, caused by depletion of ink in the cartridge or automatic printing stop caused by an Ink Out detection function.”
What is fade?
“3.1 Fade
A phenomenon where a significant reduction in uniformity occurs due to ink depletion.
NOTE In this test, fade is defined as a noticeably lighter, 3 mm or greater, gap located in the text, in the bar chart, or in the boxes around the periphery of the test page. The determination of the change in lightness is to be made referenced to the 25th page printed for each cartridge in testing. For examples of fade, please consult Annex A.”
And Annex A?
“Examples of Fade <future edit: add picture>”
Formula for calculating the standard deviation and a 90% confidence interval are given (the 90% confidence interval formula assumes a Normal distribution; I would have thought that the distribution of pages printed by a cartridge might be skewed and a bootstrap procedure would be more reliable).
It is daylight now and my interest in inkjet yield is satiated. But if you, dear reader, have a longing for more, then Ms. Michelle Pangborn (Hewlett-Packard), USA or Mr. Nobuaki Hamada (Epson), Japan are the people to contact.
Some printer test pages to add to your link collection.
DACS: Software Life Cycle Empirical/Experience Database
Economic data relating to software development is very very hard to find. Companies just don’t want to reveal how much they spent/charged to writing a software system. This kind of data is invariably confidential.
I’m currently working on the Economics chapter of my book on Empirical Software Engineering and the data is somewhat thin.
I’m hoping one of my readers can help out with a copy of the “DACS data”.
DACS (The Data & Analysis Center for Software), a US DOC information analysis center, used to sell copies of their Software Life Cycle Empirical/Experience Database for $50. The most interesting data set was the DACS Productivity Dataset containing effort and schedule data on over 500 software projects.
DACS was merged into CSIAC (Cyber Security & information systems Information Analysis Center; not sure if I capitalized the appropriate information) and the data availability is no more.
If you have a copy of this data, or know somebody who does, please send me a copy.
The person who put the data together, Richard Nelson, no longer works for the government, has a consulting firm registered in Orlando, and is an officer of the NASA Alumni League Florida Chapter. All the obvious searches for an email address fail, and I suspect that a retirement is being enjoyed.
Of course I am always happy to hear about any software engineering data that you think I don’t have.
Fault density: so costly to calculate that few values are reliable
Fault density (i.e., number of faults per thousand lines of code) often appears in claims relating to software quality.
Fault density sounds like a very useful value to know; unfortunately most quoted values are meaningless and because obtaining reliable data is very costly.
The starting point for calculating fault density is the number of reported faults (I will leave the complexity of what constitutes a line of code for a future post). Most faults don’t get reported.
If there are no reported faults, fault density is zero. The more often software is executed the more likely a fault will be experienced (i.e., the large the range of input values thrown at a program the more likely it will go down a path containing a fault). Comparing like-with-like requires knowing how many different kinds of input a program processed to experience a given number of faults; we don’t want to fall into the trap of claiming heavily used code is less fault prone than lightly used code.
What counts as a fault? One study found that 46% of reported faults in Open Source bug tracking systems were misclassified (e.g., a fault report was actually a request for enhancement). Again, comparing like-with-like requires agreement on what constitutes a fault.
How should faults in code that is no longer shipped be counted? If the current version of a program contains 100K lines and previous versions contained 50K lines that have been deleted, should the faults in those 50K lines contribute to the fault density of the current program? I would say not, which means somebody has to figure out which reported faults apply to code in the current version of the program.
I am aware of less than half a dozen fault density values that I would consider reliable (most calculated during the Rome period). Everything else is little better than reading tea-leafs.
I have been reading your interesting paper
In the last six years or so I have sent around 420 emails whose first line started: “I have been reading your interesting paper”, followed a few lines later by: “Would it be possible to obtain a copy of the data?”, and then some background and links to blog posts and my previous book.
The response break down is roughly as follows:
Received data 136 32% No reply 132 32% Pending (received a positive reply) 49 12% Confidential 42 10% No longer have the data 20 5% Best known address bounces 11 3% |
Thanks to those 136 researchers who took the time to collect together their data and send me a copy.
The “No reply” response get a second email 6-9 months after the first. I’m hoping that the availability of a draft of the book will generate some positive publicity that reminds researchers they have had an email from me and are missing out.
The “Confidential” case is relatively low because it is often obvious that the data is confidential and I don’t bother asking for a copy (I only use data that can be made public).
A common reason behind “No longer have the data” is a change of laptop and sometimes a change of jobs. If the paper is more than five years old, I tend not to ask unless the data looks very interesting. Mine and others’ experiences show that research data has a relatively short half-life.
I try quite hard to find a workable address, sometimes emailing supervisors and going via LinkedIn.
Recent Comments