Archive
Warp your data to make it visually appealing
Data plots can sometimes look very dull and need to be jazzed up a bit. Now, nobody’s suggesting that the important statistical properties of the data be changed, but wouldn’t it be useful if the points could be moved around a bit, to create something visually appealing without losing the desired statistical properties?
Readers have to agree that the plot below looks like fun. Don’t you wish your data could be made to look like this?

Well, now you can (code here, inspired by Matejka and Fitzmaurice who have not released their code yet). It is also possible to thin-out the points, while maintaining the visual form of the original image.
The idea is to perturb the x/y position of very point by a small amount, such that the desired statistical properties are maintained to some level of accuracy:
check_prop=function(new_pts, is_x)
{
if (is_x)
   return(abs(myx_mean-stat_cond(new_pts)) < 0.01)
else
   return(abs(myy_mean-stat_cond(new_pts)) < 0.01)
}


mv_pts=function(pts)
{
repeat
   {
   new_x=pts$x+runif(num_pts, -0.01, 0.01)
   if (check_prop(new_x, TRUE))
      break()
   }

repeat
   {
   new_y=pts$y+runif(num_pts, -0.01, 0.01)
   if (check_prop(new_y, FALSE))
      break()
   }

return(data.frame(x=new_x, y=new_y))
} |
The distance between the perturbed points and the positions of the target points then needs to be calculated. For each perturbed point its nearest neighbor in the target needs to be found and the distance calculated. This can be done in  using kd-trees and of course there is an R package, RANN, do to this (implemented in the
 nn2 function). The following code tries to minimize the sum of the distances, another approach is to minimize the mean distance:
mv_closer=function(pts)
{
repeat
   {
   new_pts=mv_pts(pts)
   new_dist=nn2(rabbit, new_pts, k=1)
   if (sum(new_dist$nn.dists) < cur_dist)
      {
      cur_dist <<- sum(new_dist$nn.dists)
      return(new_pts)
      }
   }

} |
Now it’s just a matter of iterating lots of times, existing if the distance falls below some limit:
iter_closer=function(tgt_pts, src_pts)
{
cur_dist <<- sum(nn2(tgt_pts, src_pts, k=1)$nn.dists)
cur_pts=src_pts
for (i in 1:5000)
   {
   new_pts=mv_closer(cur_pts)
   cur_pts=new_pts
   if (cur_dist < 13)
      return(cur_pts)
   }
return(cur_pts)
} |
This code handles a single statistical property. Matejka and Fitzmaurice spent more than an hour on their implementation, handle multiple properties and use simulated annealing to prevent being trapped in local minima.
An example, with original points in yellow:
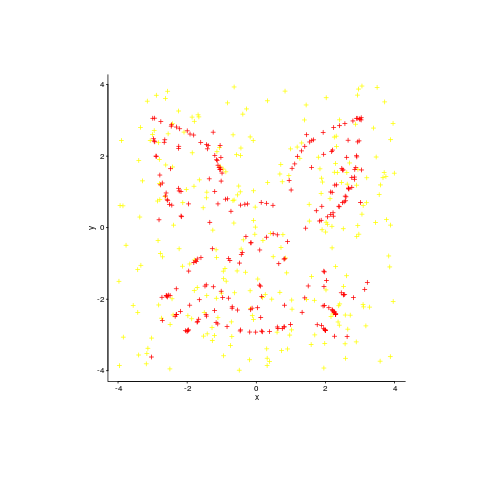
Enjoy.
Recent Comments