Archive
Estimation accuracy in the (building|road) construction industry
Lots of people complain about software development taking longer than estimated. Are estimates in other industries more accurate, and do they contain patterns similar to those seen in software task estimates?
Readers will probably not be surprised to learn that obtaining estimate/actual data is as hard for other industries as it is for software.
Software engineering sometimes gets compared with building construction, in the sense that building construction is perceived as being straightforward and predictable. My tiny experience with building construction is that it is not as straightforward and predictable as outsiders think, a view echoed by the few people in the building industry I have spoken to.
I have found two building datasets, the supplementary material from: Forecasting the Project Duration Average and Standard Deviation from Deterministic Schedule Information (the 101 rows also include some service projects), and Ballesteros-Pérez kindly sent me the data for Duration and Cost Variability of Construction Activities: An Empirical Study which included 746 rows of road construction estimate/actual data from an unknown source. This data is for large projects, where those involved had to bid to get the work.
The following plot reminds us of how effort vs actual often looks like for short software tasks; it includes a fitted regression model and prediction intervals at one standard deviation (68.3%) and two standard deviations (95%); the faint grey line shows Estimate == Actual (post discussing the analysis and linking to code+data):
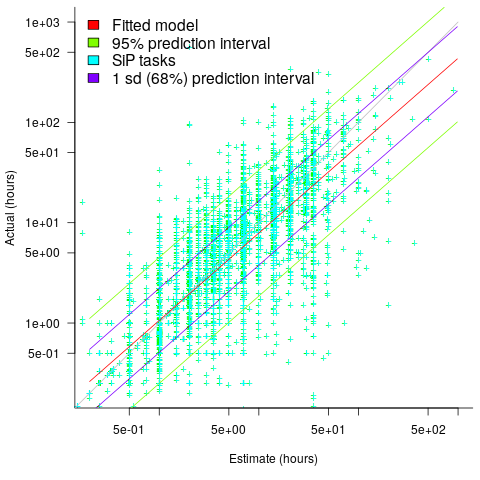
The data in the above plot is for small tasks, which did not involve bidding for the work.
The following plot shows estimated vs actual duration for 101 construction projects. The red line has the form:  , i.e., average estimate is 9% lower than actual duration (blue line shows
  ; code+data).
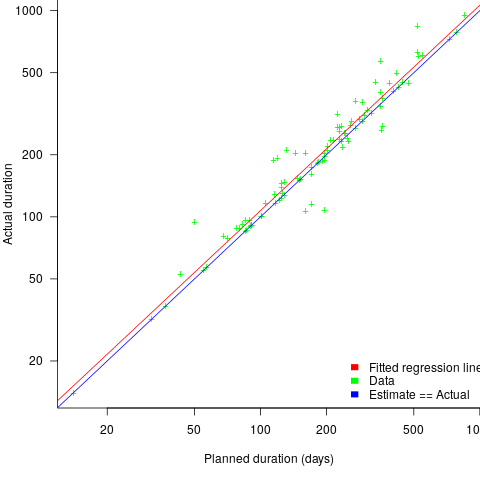
The obvious differences are that the fitted line shows consistent underestimation (hardly surprising when bidding for work; 16% of estimates are greater than the actual), that the variance of project estimate/actual about the line is much smaller for building construction, and that the red/blue lines are essentially parallel (the exponent for software tasks is consistently around 0.85, rather than 1)
The following plot shows estimated vs actual for 746 road construction projects. The red line has the form:  , i.e., average estimate is 24% lower than actual duration (blue line shows ; code+data):
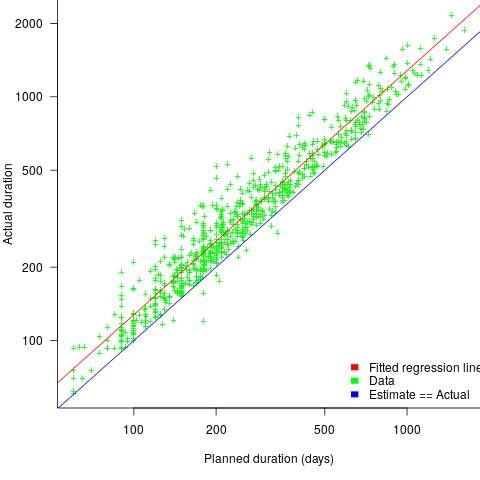
Again there is a consistent average underestimate (project bidding was via an auction process), the red/blue lines are essentially parallel, and while the estimate/actual variance is larger than for building construction only 1.5% estimates are greater than the actual.
Consistent underestimating is not surprising for external projects awarded via a bidding process.
The unpredicted differences are the much smaller estimate/actual variance (compared to software), and the fitted line running parallel to .
Estimating variance when measuring source
Yesterday I finally delivered a paper on if/switch usage measurements to the ACCU magazine editor and today I read about a switch statement usage that, if common, would invalidate a chunk of my results. Does anything jump out at you in the following snippet?
switch (x) { case 1: { z++; ... break; } ... |
Yes, those { } delimiting the case-labeled statement sequence. A quick check of my C source benchmarks showed this usage occurring in around 1% of case-labels. Panic over.
What is the statistical significance, i.e., variance, of that 1%? Have I simply measured an unrepresentative sample, what would be a representative sample and what would be the expected variance within a representative sample?
I am interested in commercial software development, and so I have selected half a dozen or so largish code bases as my source benchmark, preferably written in a commercial environment even if currently available as Open source. I would prefer this benchmark to be an order of magnitude larger, and perhaps I will get around to adding more programs soon.
My if/switch measurements were aimed at finding usage characteristics that varied between the two kinds of selection statements. One characteristic measured was the number of equality tests in the associated controlling expression. For instance, in:
if (x == 1 || x == 2) z--; else if (x == 3) z++; |
the first controlling expression contains two equality tests, and the second one equality test.
Plotting the percentage of equality tests that occur in the controlling expressions of if-if/if-else-if sequences and switch statements, we get the following:
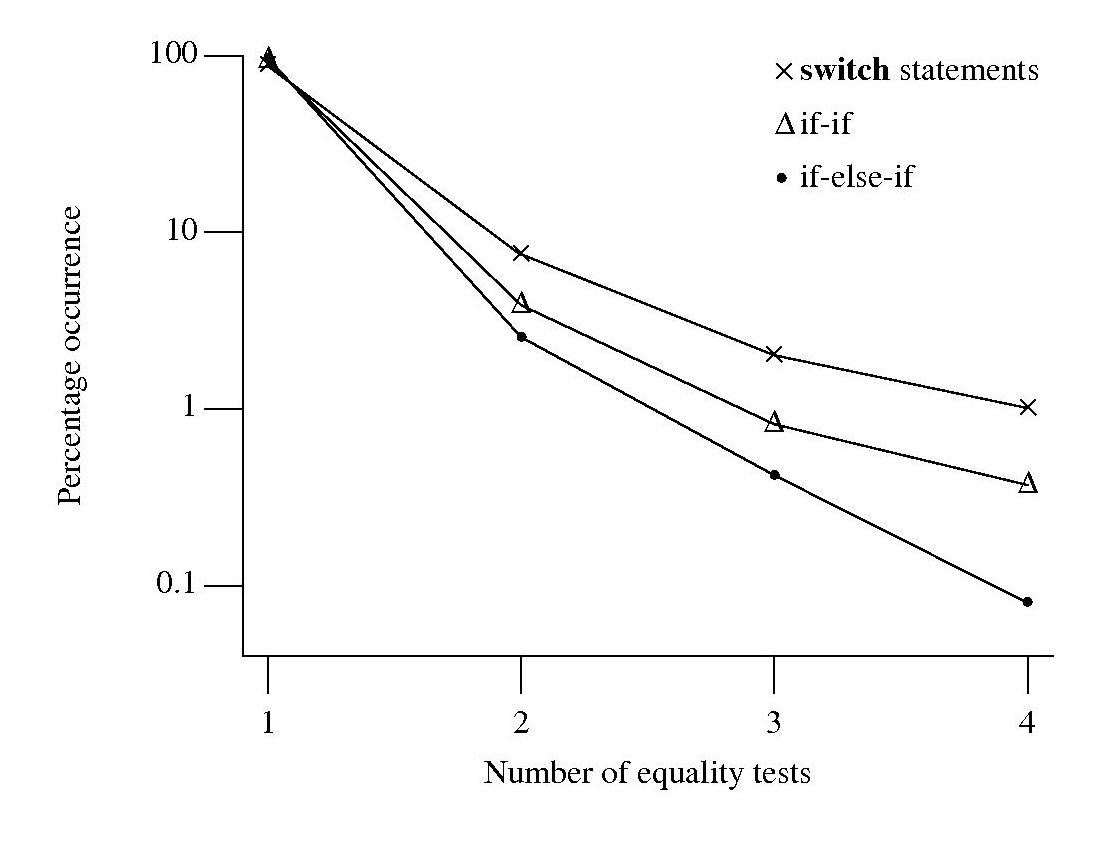
Do these results indicate that if-if/if-else-if sequences and switch statements differ in the number of equality tests contained in their controlling expressions? If I measured a completely different set of source code, would the results be very different?
To answer this question, a probability model is needed. Take as an example, the controlling expressions present in an if-if sequence. If each controlling expression is independent of the others, then the probability of two equality tests, for instance, occurring in any of these expressions is constant and thus given a large sample the distribution of two equality tests in the source has a binomial distribution. The same argument can be applied to other numbers of equality tests and other kinds of sequence.
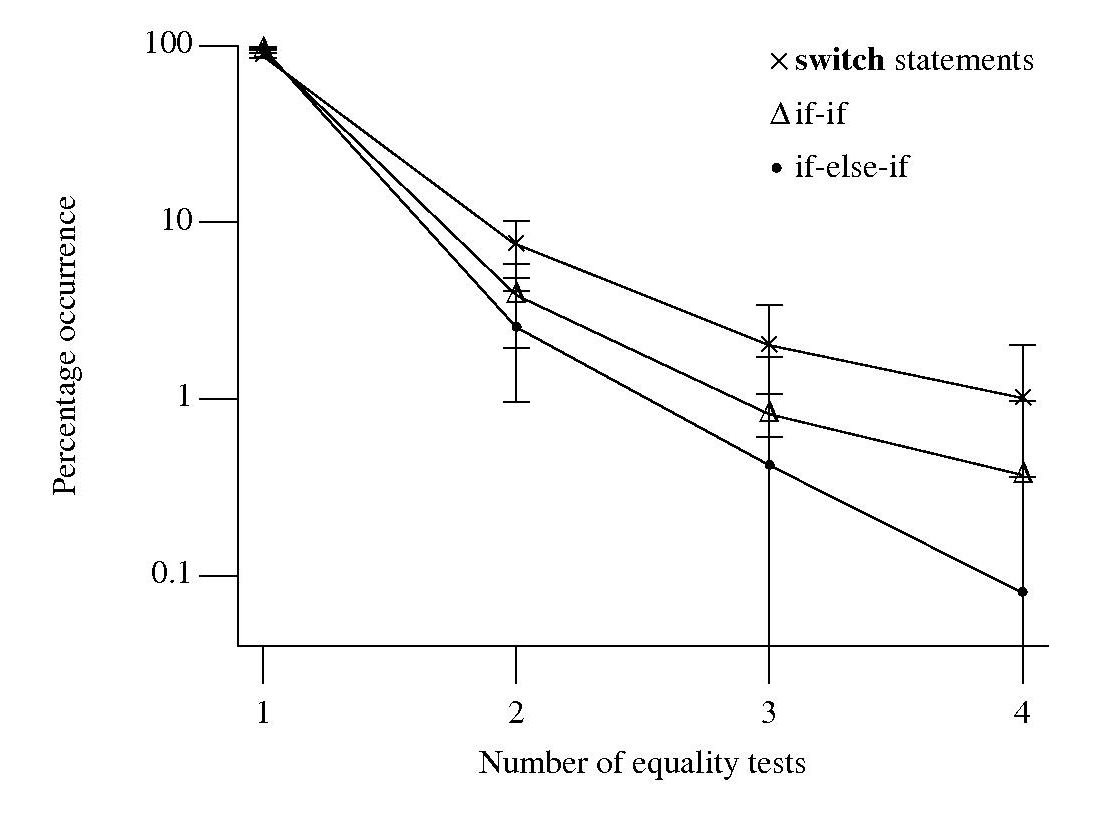
For each measurement point in the above plot the associated error bars span the square-root of the variance of that point (assuming a binomial distribution, for a normal distribution the length of this span is known as the standard deviation). The error bars overlap, suggesting that the apparent difference in percentage of equality tests in each kind of sequence is not statistically significant.
The existence of some dependency between controlling expression equality tests would invalidate this simply analysis, or at least reduce its reliability. I did notice that in a sequence that containing two equality tests, the controlling expression that contained it tended to appear later in the sequence (the reverse of the example given above). Did I notice this because I tend to write this way? A question for another day.
Recent Comments