Archive
Functions reduce the need to remember lots of variables
What, if any, are the benefits of adding bureaucracy to a program by organizing a file’s source code into multiple function/method definitions (rather than a single function)?
Having a single copy of a sequence of statements that need to be executed at multiple points in a program reduces implementation effort, and any updates only need to be made once (reducing coding mistakes by removing the need to correctly make duplicate changes). A function/method is the container for this sequence of statements.
Why break code up into separate functions when each is only called once and only likely to ever be called once?
The benefits claimed from splitting code into functions include: making it easier to understand, test, debug, maintain, reuse, and scale development (i.e., multiple developers working on the same program). Our LLM overlords also make these claims, and hallucinate references to published evidence (after three iterations of pointing out the hallucinated references, I gave up asking for evidence; my experience with asking people is that they usually remember once reading something but cannot remember the source).
Regular readers will not be surprised to learn that there is little or no evidence for any of the claimed benefits. I’m not saying that the benefits don’t exist (I think there are some), simply that there have not been any reliable studies attempting to measure the benefits (pointers to such studies welcome).
Having decided to cluster source code into functions, for whatever reason, are there any organizational rules of thumb worth following?
Rules of thumb commonly involve function length (it’s easy to measure) and desirable semantic characteristics of distinct functions (it’s very hard to measure semantic characteristics).
Claims for there being an optimal function length (i.e., lines of code that minimises coding mistakes) turned out to be driven by a mathematical artifact of the axis used when plotting (miniscule) datasets.
Semantic rules of thumb such as: group by purpose, do one thing, and Single-responsibility principle are open to multiple interpretations that often boil down to personal preferences and experience.
One benefit of using functions that is rarely studied is the restricted visibility of local variables defined within them, i.e., only visible within the function body.
When trying to figure out what code does, readers have to keep track of the information contained in all the variables accessed. Having to track more variables not only increases demands on reader memory, it also increases the opportunities for making mistakes.
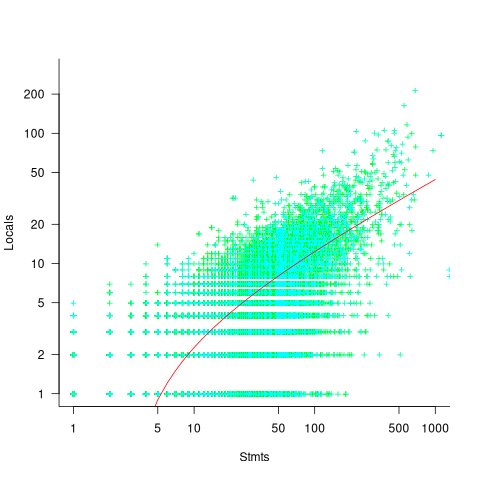
A study of C source found that within a function, the number of local variables is proportional to the square root of the number of statements (code+data). Assuming the proportionality constant is one, a function containing 100 statements might be expected to define 10 local variables. Splitting this function up into, say, four functions containing 25 statements, each is expected to define 5 local variables. The number of local variables that need to be remembered at the same time, when reading a function definition, has halved, although the total number of local variables that need to be remembered when processing those 100 statements has doubled. Some number of global variables and function parameters need to be added to create an overall total for the number of variables.
The plot below shows the number of locals defined in 36,617 C functions containing a given number of statements, the red line is a fitted regression model having the form:  (code+data):
My experience with working with recently self-taught developers, especially very intelligent ones, is that they tend to write monolithic programs, i.e., everything in one function in one file. This minimal bureaucracy approach minimises the friction of a stream of thought development process for adding new code, and changing existing code as the program evolves. Most of these programs are small (i.e., at most a few hundred lines). Assuming that these people continue to code, one of two events teaches them the benefits of function bureaucracy:
- changes to older programs becomes error-prone. This happens because the developer has forgotten details they once knew, e.g., they forget which variables are in use at particular points in the code,
- the size of a program eventually exceeds their ability to remember all of it (very intelligent people can usually remember much larger programs than the rest of us). Coding mistakes occur because they forget which variables are in use at particular points in the code.
Preferential attachment applied to frequency of accessing a variable
If, when writing code for a function, up to the current point in the code  distinct local variables have been accessed for reading
  times (
 ), will the next read access be from a previously unread local variable and if not what is the likelihood of choosing each of the distinct variables (global variables are ignored in this analysis)?
Short answer:
- With probability
 select a new variable to access,
 - otherwise select a variable that has previously been accessed in the function, with the probability of selecting a particular variable being proportional to
 (where
  is the number of times the variable has previously been read from.
The longer answer is below as another draft section from my book Empirical software engineering with R. As always comments and pointers to more data welcome. R code and data here.
The discussion on preferential attachment is embedded in a discussion of model building.
What kind of model to build?
The obvious answer to the question of what kind of model to build is, the cheapest one that produces the desired output.
Many of the model building techniques discussed in this book find patterns in the data and effectively return one or more equations that produce output similar to the data given some set of inputs; the equations are the model.
The advantage of this approach is that in many cases the implementation of the model building has been automated (I don’t say much about those that have not yet been automated), the user contribution is in choosing which kind of model to build. In some cases the R function requires that the user provide a general direction of attack (e.g., the form of function to use in fitting a nonlinear regression).
An alternative kind of model is one whose output is obtained by running an iterative algorithm, e.g., a time series created by calculating the next value in a sequence from one or more previous values.
In most cases a great deal of domain knowledge is required of the user building the model, while in a few cases an automated procedure for creating the iterative algorithm and its parameters is available, e.g., time series analysis.
There is never any guarantee that any created model will be sufficiently accurate to be useful for the problem at hand; this is a risk that occurs in all model building exercises.
The following discussion builds two models, one using an established automated model building technique (regression) and the other using an iterative algorithm built using domain knowledge coupled with experimentation.
The problem
Consider local variable usage within a function. If a function contains a total of  read accesses to locally defined variables, how many variables will be read from only once, how many twice and so on (this is a static count extracted from the source code, not a dynamic count obtained by executing the function)?
The data for the following analysis is from Jones <book Jones_05a> (see figure 1821.5) and contains three columns, total count: the total number of read accesses to all variables defined within a function definition, object access: the number of read accesses from a distinct local variable, and occurrences: the number of distinct variables that have at least one read access within the function (i.e., unused variables are not counted); the occurrences counts have been summed over all functions.
In the following extract, within functions containing 24 totals accesses there were 783 occurrences of variables accessed once, 697 occurrences of variables accessed twice and so on.
total access,object access,occurrences 24,1,783 24,2,697 24,3,474 |
The data excludes everything about source code apart from read access information.
Fitting an equation to the data
Plotting the data shows an exponential-like decrease in occurrences as the number of accesses to a variable increases (i.e., most variables are accessed a small number of time); also there is an overall increase in the counts as the total numbers of accesses increases (see below).
The fit obtained by the nls function for a simple exponential equation is the following (all p-values less than  ; see rexample[local-use]):
where  is the number of read accesses to a given variable and is the total accesses to all local variables within the function. Because the data has been normalised the value returned is a percentage.
As an example, a function containing a total of 30 read accesses of local variables the expected percentage of variables accessed twice is:  .
.
Modeling with an incremental algorithm
If, when writing code for a function, up to the current point in the code distinct local variables have been accessed for reading times (), will the next read access be from a previously unread local variable and if not what is the likelihood of choosing each of the distinct variables (global variables are ignored in this analysis)?
Each access in the code of a local variable could be thought of as a link to the information contained in that variable. One algorithm that has been found to do a reasonable job of modeling the number of links between web pages is Preferential attachment. Might this algorithm also be applicable to modeling read accesses to local variables?
The Preferential attachment algorithm is:
- With probability
 select a new web page (in this case a new variable to access),
 - with probability
 select an existing web page (a variable that has previously been accessed in the function), select a variable with a probability proportional to the number of times it has previously been accessed (i.e., a variable that has four previous read accesses is twice as likely to be chosen as one that has had two previous accesses).
The following plot shows the results of running this algorithm 1,000 times each with 100 total accesses per function definition, for two values of (left plot 0.05, right plot 0.0004, red points) and smoothed data (blue points; smoothing involved summing the access counts for all measured functions having total accesses between 96 and 104), green line is a fitted exponential. Values have been normalised so that variables with one access have a count of 100, also access counts greater than 20 have a very low occurrences and are not plotted.
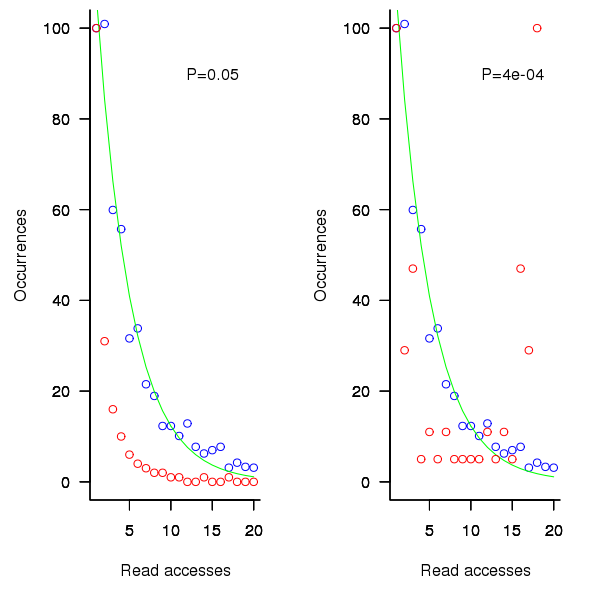
Figure 1. Variables having a given number of read accesses, given 100 total accesses, calculated from running the preferential attachment algorithm with probability of accessing a new variable at 0.05 (left, in red) and 0.0004 (right, in red), the smoothed data (blue) and a fitted exponential (green).
The results show that decreasing the probability of accessing a new variable, , does not shift the distribution of occurrences in the desired way. Note: the well known analytic solution to the outcome of running the preferential attachment algorithm, i.e., a power law, applies in the situation where the number of accesses per function definition goes to infinity.
The Preferential attachment algorithm uses a fixed probability for deciding whether to access a new variable; other measurements <book Jones_05a> imply that in practice this probability decreases as the number of distinct local variables increases. An obvious modification is to use a probability having a form something like
the number of distinct variables accessed so far). A little experimentation finds that produces results that more closely mimic the data.
While improves the fit for infrequently accessed variables, the weighting system used to select a previously accessed variable still needs attention; perhaps it also has a dependency on . Some experimentation finds that changing the probability of selection from to  (where is the number of read accesses to variable
  so far) produces behavior that matches the data to the same degree as the exponential model.
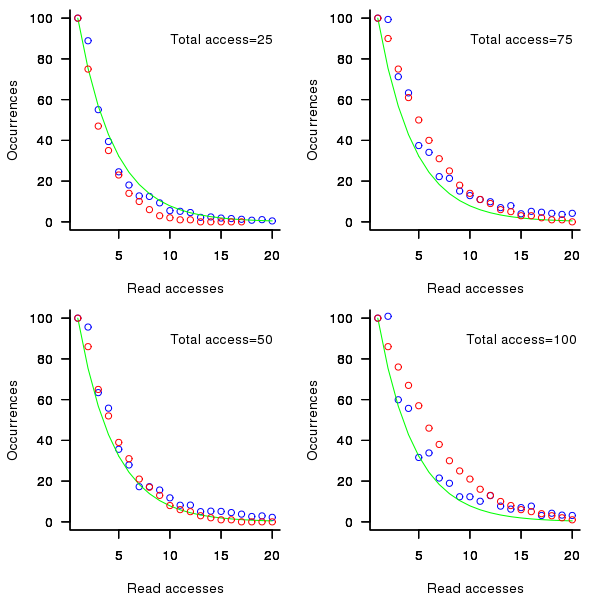
Figure 2. Variables having a given number of read accesses, given 25, 50, 75 and 100 total accesses, calculated from running the weighted preferential attachment algorithm (red), the smoothed data (blue) and a fitted exponential (green).
The weighted preferential attachment algorithm is as follows:
- With probability select a new variable to access,
- with probability
 select a variable that has previously been accessed in the function, select an existing variable with probability proportional to (where is the number of times the variable has previously been read from; e.g., if the total accesses up to this point in the code is 12, a variable that has had four previous read accesses is
  times as likely to be chosen as one that has had two previous accesses).
So what?
Both of the models are wrong in that they do not account for the small number of very frequently accessed variables that regularly occur in the data. However, as the adage goes: All models are wrong but some are useful; usefulness being evaluated by the extent to which a model solves the problem at hand. Both models have their own advantages and disadvantages, including:
- the fitted equation is quick and simple to calculate, while the output from the algorithmic model has to be averaged over many runs (1,000 are used in the example code) and is much slower,
- the algorithm automatically generates a possible sequence of accesses, while the equation does not provide an obvious way for generating a sequence of accesses,
- multiple executions of the algorithm can be used to obtain an estimate of standard deviation, while the equation does not provide a method for estimating this quantity (it may be possible to build another regression model that provides this information),
If insight into variable usage is the aim, each model provides its own particular kind of insight:
- the equation provides an end result way of thinking about how the number of variables having a given number of accesses changes, but does not provide any insight into the decision process at the level of individual accesses,
- the algorithm provides a way of thinking about how choices are made for each access, but does not provide any insight into the behavior of the final counts.
Other application domains and languages
The data used to build these models was extracted from the C source code of what might be termed desktop applications. Will the same variable access behavior characteristics occur in source written for other application domain or in other languages?
Variables might be broadly grouped into those used to hold application values (e.g., length of something) and those used to hold housekeeping values (e.g., loop counters).
Application variables are likely to be language invariant but have some dependence on algorithm (e.g., stored in an array or linked list) or cultural coding habits (e.g., within the embedded community accessing local variables is often considered to be much less efficient than accessing global variables and there are measurably different usage patterns <book Engblom_99a><book Jones 05a> figure 288.1).
The need for housekeeping values will depend on the construct supported by a language. For instance, in C loops often involve three accesses to the loop control variable to initialise, increment and test it for (i=0; i < 10; i++); in languages that support usage of the form for (i in v_list) only one access is required; in languages with vector operations many loops are implicit.
It is possible that application and language issues will change the absolute number of accesses but not effect their distribution. More measurements are needed.
Generating code that looks like it is human written
I am very interested in understanding the patterns of developer behavior that lead to the human characteristics that can be found in code. To help me get some idea of how well I understand this behavior I have decided to build a tool that generates source code that appears to be written by human programmers. I hope to reach a point where I can offer a challenge to tell the difference between generated code and human written code.
The three main production techniques I plan to use are, in increasing order of relatedness to humans production techniques, are:
- Random generation based on percentage occurrence of language constructs obtained from measurements of existing source. This is the simplest approach and the one furthest away from common developer behavior; even so there are things that can be learned from this information. For instance, the theory that developers are more likely to create a function once code becomes heavily nested code implies that the probability of encountering an if-statement decreases as nesting depth increases; measurements show the probability of encountering an if-statement remaining approximately constant as depth of nesting increases.
- Behavior templates. People have habits in everyday life and also when writing software. While some habits are idiosyncratic and not encountered very often there are some that appear to be generally used. For instance, developers tend to assign a fixed role to every variable they define (e.g., stepper for stepping through a succession of values and most-recent holder holding the latest value encountered in going through a succession of values).
I am expecting/hoping that generation by behavioral templates will result in code having some of the probabilistic properties seen in human code, removing the need for purely random generation driven by low level language probability measurements. For instance, the probability of a local variable appearing in a function is proportional to the percentage of its previous occurrences up to that point in the source of the function (
percentage = occurrences_of_X / occurrences_of_all_local_variables) and I am hoping that this property appears as emergent behavior from generating using the role of variable template. - Story telling. A program is like the plot of a story, it has a cast of characters (e.g., classes, functions, libraries) that perform various actions and interact with each other in order to achieve various goals, there are subplots (intermediate results are calculated, devices are initialized, etc), there are resource limits, etc.
While a lot of stories are application domain specific there are subplots common to many stories; also how a story is told can be heavily influenced by the language used, for instance Prolog programs have a completely different structure than those written in procedural languages such as Java. I want to stay away from being application specific and I don’t plan to tackle languages too far outside the common-or-garden procedural variety.
Researchers have created automatic story generators; the early generators were template based while more recent systems have used an agent based approach. Story based generation of code is my ideal, but I am a long way away from having enough knowledge of developer behavior to be more than template based.
In a previous post I described a system for automatically generating very simply C programs. I plan to build on this system to incrementally improve the ‘humanness’ of the generated code. At some point, hopefully before the end of this year, I will challenge people to tell the difference between automatically generated and human written code.
The language I have studied the most is C and this will be the main target. I don’t want to be overly C specific and am trying to decide on a good second language (i.e., lots of source available for measurement, used by lots of developers and not too different from C). JavaScript is the current front runner, it is a class-less object oriented language which is not ‘wildly’ OO (the patterns of usage in human written OO code continue to evolve at a rapid rate which can make a lot of human C++/Java code look automatically generated).
As well as being a test bed for understanding of human generated code other uses for an automatic generator include compiler stress testing and providing code snippets to an automated fault fixing tool.
Recent Comments