Archive
Performance variation in 2,386 ‘identical’ processors
Every microprocessor is different, random variations in the manufacturing process result in transistors, and the connections between them, being fabricated with more/less atoms. An atom here and there makes very little difference when components are built from millions, or even thousands, of atoms. The width of the connections between transistors in modern devices might only be a dozen or so atoms, and an atom here and there can have a noticeable impact.
How does an atom here and there affect performance? Don’t all processors, of the same product, clocked at the same frequency deliver the same performance?
Yes they do, an atom here or there does not cause a processor to execute more/less instructions at a given frequency. But an atom here and there changes the thermal characteristics of processors, i.e., causes them to heat up faster/slower. High performance processors will reduce their operating frequency, or voltage, to prevent self-destruction (by overheating).
Processors operating within the same maximum power budget (say 65 Watts) may execute more/less instructions per second because they have slowed themselves down.
Some years ago I spotted a great example of ‘identical’ processor performance variation, and the author of the example, Barry Rountree, kindly sent me the data. In the weeks before Christmas I finally got around to including the data in my evidence-based software engineering book. Unfortunately I could not figure out what was what in the data (relearning an important lesson: make sure to understand the data as soon as it arrives), thankfully Barry came to the rescue and spent some time doing software archeology to figure out the data.
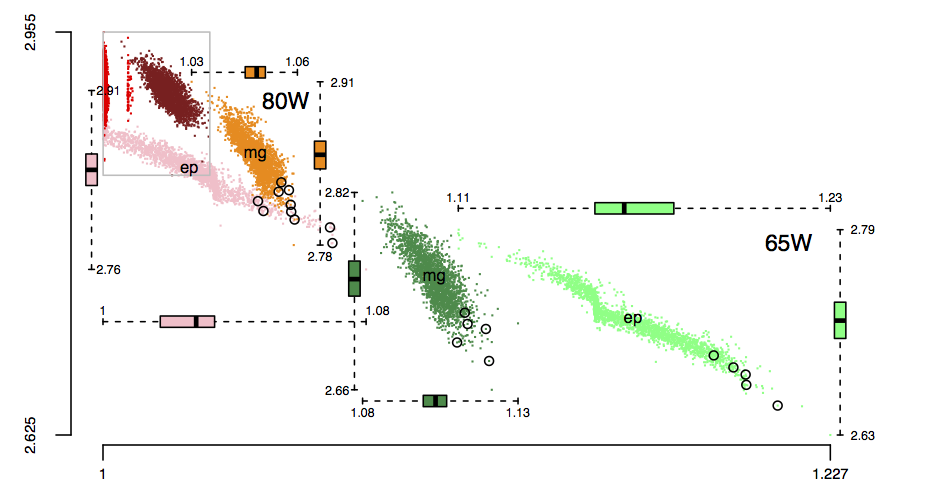
The original plots showed frequency/time data of 2,386 Intel Sandy Bridge XEON processors (in a high performance computer at the Lawrence Livermore National Laboratory) executing the EP benchmark (the data also includes measurements from the MG benchmark, part of the NAS Parallel benchmark) at various maximum power limits (see plot at end of post, which is normalised based on performance at 115 Watts). The plot below shows frequency/time for a maximum power of 65 Watts, along with violin plots showing the spread of processors running at a given frequency and taking a given number of seconds (my code, code+data on Barry’s github repo):
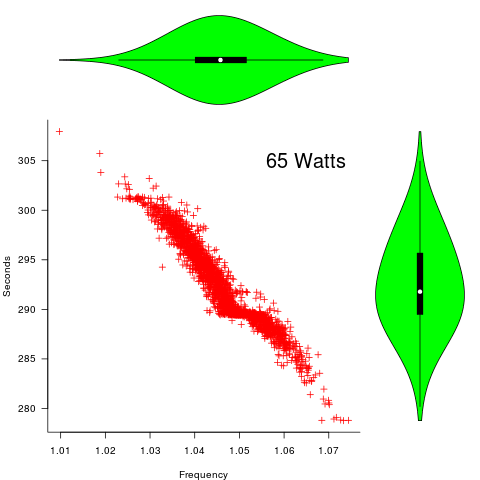
The expected frequency/time behavior is for processors to lie along a straight line running from top left to bottom right, which is roughly what happens here. I imagine (waving my software arms about) the variation in behavior comes from interactions with the other hardware devices each processor is connected to (e.g., memory, which presumably have their own temperature characteristics). Memory performance can have a big impact on benchmark performance. Some of the other maximum power limits, and benchmark, measurements have very different characteristics (see below).
More details and analysis in the paper: An empirical survey of performance and energy efficiency variation on Intel processors.
Intel’s Sandy Bridge is now around seven years old, and the number of atoms used to fabricate transistors and their connectors has shrunk and shrunk. An atom here and there is likely to produce even more variation in the performance of today’s processors.
A previous post discussed the impact of a variety of random variations on program performance.
Update start
A number of people have pointed out that I have not said anything about the impact of differences in heat dissipation (e.g., faster/slower warmer/cooler air-flow past processors).
There is some data from studies where multiple processors have been plugged, one at a time, into the same motherboard (i.e., low budget PhD research). The variation appears to be about the same as that seen here, but the sample sizes are more than two orders of magnitude smaller.
There has been some work looking at the impact of processor location (e.g., top/bottom of cabinet). No location effect was found, but this might be due to location effects not being consistent enough to show up in the stats.
Update end
Below is a png version of the original plot I saw:
Expected variability in a program’s SLOC
If 10 people independently implement the same specification in the same language, how much variation will there be in the length of their programs (measured in lines of code)?
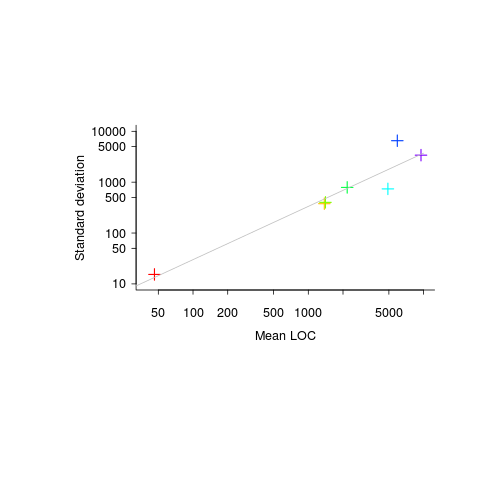
The data I have suggests that the standard deviation of program length is one quarter of the mean length, e.g., 10k mean length, 2.5k standard deviation.
The plot below (code+data) shows six points from the samples I have. The point in the bottom left is based on 6,300 C programs from a programming contest question requiring solutions to the 3n+1 problem and one of the points on the right comes from five Pascal compilers for the same processor.
Multiple implementations of the same specification, in the same language, are very rare. If you know of any, please let me know.
The dance of the dead cat
The flagging of unspecified behavior in C source by static analysis tools (i.e., where the standard specifies two or more possible behaviors for translators to choose from when generating code) is starting to rather get sophisticated, some tools are working out and reporting how many different program outputs are possible given the unspecified behavior in the source (traditionally tools simply point at code containing an instance of unspecified behavior).
A while ago I created a function where the number of possible different values returned, driven by one unspecified behavior in the code, was a Fibonacci number (the value of the function parameter selected the n’th Fibonacci number).
Weird ways of generating Fibonacci numbers are great for entertaining fellow developers, but developers are unlikely to be amused by a tool that flags their code as generating Fibonacci possible values (rather than the one they are expecting).
The possibility of Fibonacci different values relies on the generated code cycling through all possible behaviors, allowed by the standard, at runtime. This can only happen if program execution uses a Just-in-Time compiler; the compile once before execution implementations used by most developers get to generate far fewer possible permitted values (i.e, two for this particular example). Who would be crazy enough to write a JIT compiler for C you ask? Those crazy people who translate C to JavaScript for one.
To be useful for developers who are not using a JIT compiler to execute their C code, static analysis tools that work out the number of possible values that could be produced are going to have to support a code-compiled-before-execution option. Tools that don’t support this option will have what they report dismissed as weird possibilities that cannot happen in the developer’s world.
In the code below, does setting the code-compiled-before-execution option guarantee that the function Schrödinger always returns 1?
int x; int set_x(void) { x=1; return 1; } int two_values(void) { x=0; return x + set_x(); // different evaluation order -> different value } bool Schrödinger(void) { return two_values() == two_values(); } |
A compiler is free to generate code that returns a value that depends on whether two_values appears as the left or right operand of a binary operator. Not the kind of behavior an implementor would choose on purpose, but inlining both calls could result in different evaluation orders for the two instances of the code contained in what was the function body.
Our developer friendly sophisticated static analysis tool vendor is going to have to support a different_calls_to_same_function_have_same_behavior option.
How can a developer find out whether the compiler they were using always generated code having the same external behavior for different instances of calls, in the source, to the same function? Possibilities include reading the compiler source and asking the compiler vendor (perhaps future releases of gcc and llvm will support a different_calls_to_same_function_have_same_behavior option).
As far as I know (not having spent a lot of time looking) none of the tools doing the sophisticated unspecified behavior stuff support either of the developer friendly options I am suggesting need to be supported. Tools I know about include: c-semantics (including its go faster commercial incarnation) and ch2o (which the authors tell me executes the Fibonacci code a lot faster than c-semantics; last time I looked ch2o needed more installation time for the support tools it uses than I was willing to spend, so I have not tried it); the Cerberus project has not released the source of their system yet (I’m assuming they will).
Hardware variability may be greater than algorithmic improvement
I’m giving a talk at COW 39 this week and it is more user friendly to include links in this summary than link to a pdf of the slides (which actually looks horrible).
Microelectronic fabrication has now reached the point where it etches and deposits handfuls of atoms (around 20 or so). One consequence of working with such a small number of atoms is that variations in the fabrication process (e.g., plus or minus a few atoms here and there) can have a significant impact on component characteristics, e.g., a transistor consumes more/less power or can be switched faster/slower. It might be argued that things will average out over the few hundred+ million components inside a device and that all devices will be essentially the same; measurements show that in practice there is a lot of variation across the devices.
Short version: Some properties of supposedly identical microelectronic devices now vary by around 10% and this variability is likely to get larger in the future.
Nearly all published papers involving computer system power measurement are based on measuring a single system. Many of the claimed algorithmic improvements are less than 10%, i.e., less than the expected variation in power consumption across supposedly identical devices/systems. These days any empirical paper involving power consumption has to include measurements from many devices/systems if any credibility is to be given to the findings.
The following measurement data has been found while researching for a book (code and data used for talk); a beta version of the pdf will be available for download real soon now.
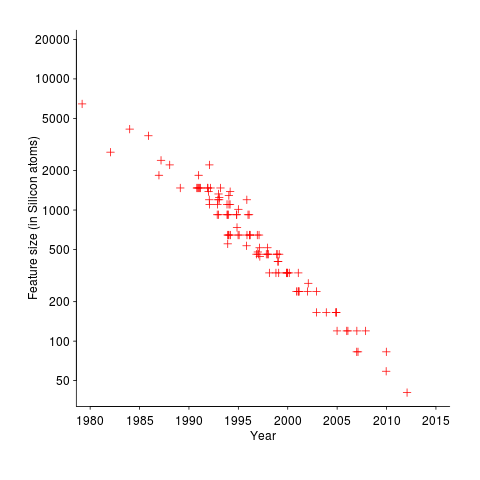
The following plot shows feature size, in Silicon atoms, of released microprocessors. Data from Danowitz et al.
A study by Wanner, Apte, Balani, Gupta and Srivastava measured the power consumed by 10 separate Amtel SAM3U microcontrollers at various temperatures (embedded processors get used in a wide range of environments). The following plot shows how power consumption varied between processors at different temperatures when idling and executing. The relationship between the power characteristics of different processors changes with temperature; a large amount when idling and a little bit when executing.
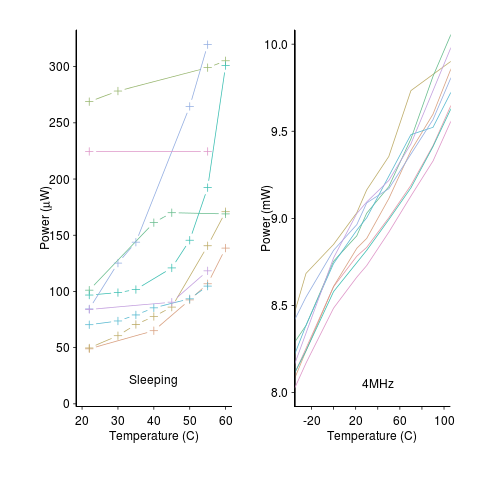
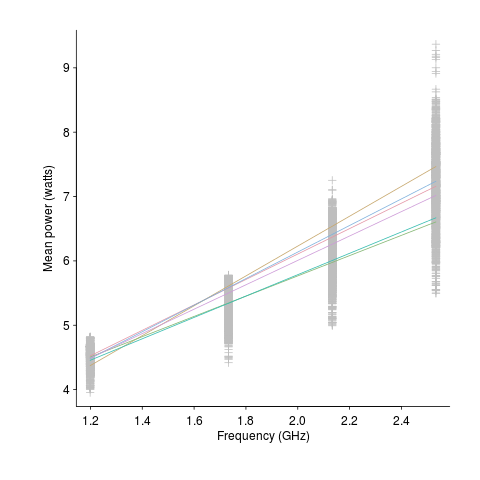
A study by Balaji, McCullough, Gupta and Agarwal measured the power consumption of six different Intel Core i5-540M processors, running at various frequencies, executing the SPEC2000 benchmark. The lines in the following plot were fitted to the data (grey crosses) using linear regression. The relationship between the power characteristics of different processors changes with clock frequency.
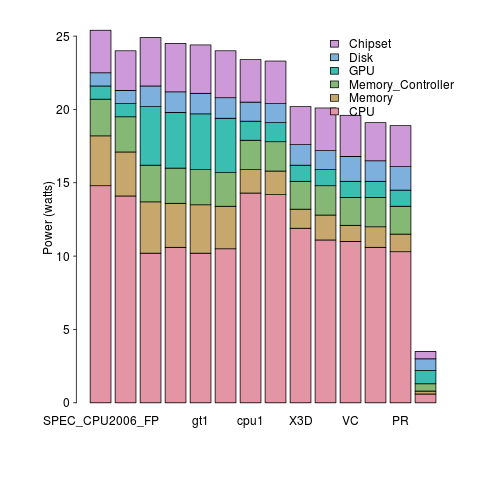
A study by Bircher measured power consumption of various system components, of an Intel server containing four Pentium 4 Xeons, when executing the SPEC CPU2006 benchmark. The power distribution for mobile devices would show the screen being the largest user of power, but I don’t have that data).
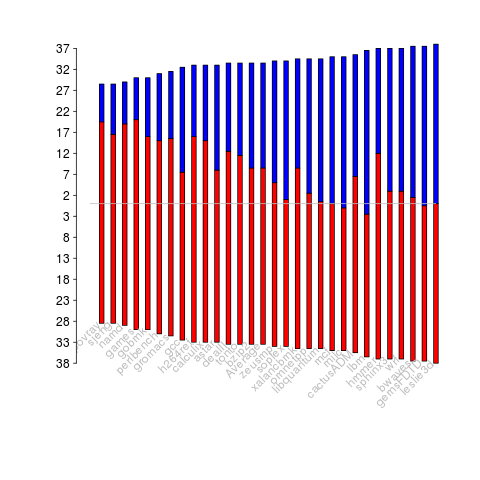
A study by Bircher measured memory (blue) and cpu (red) power consumption, in watts, executing the SPEC CPU2006 benchmarks. No point optimizig cpu power if over half the total power is consumed by memory.
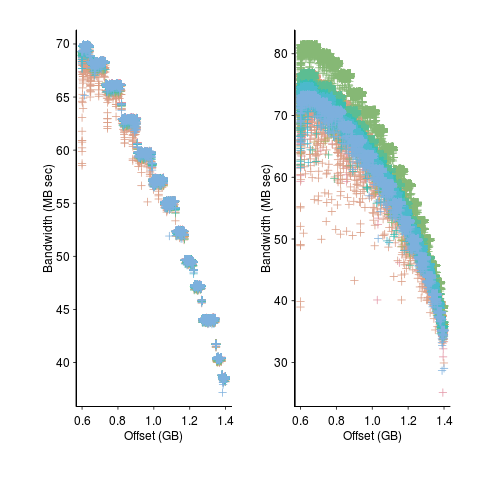
A study by Krevat, Tucek and Ganger measured the performance of then modern disk drives originally sold in 2002 (left) and 2006 (right). Different colors showing through on the right indicates that some discs have different performance characteristics than the others (faster performance -> less time -> less power, i.e., I don’t have power data for disk differences)
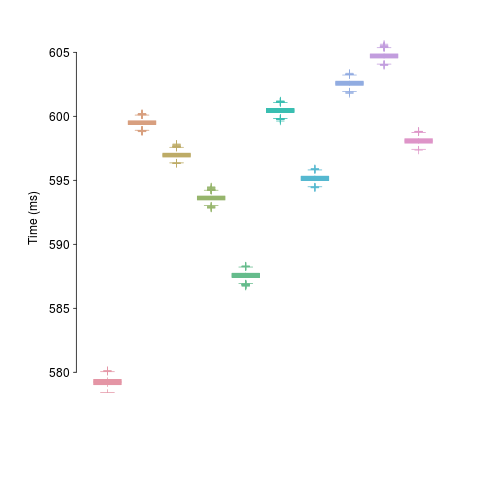
A study by Kalibera et al executed a benchmark 2,048 times followed by system reboot, repeated 10 times. Performance is consistent within a particular reboot, but not across them.
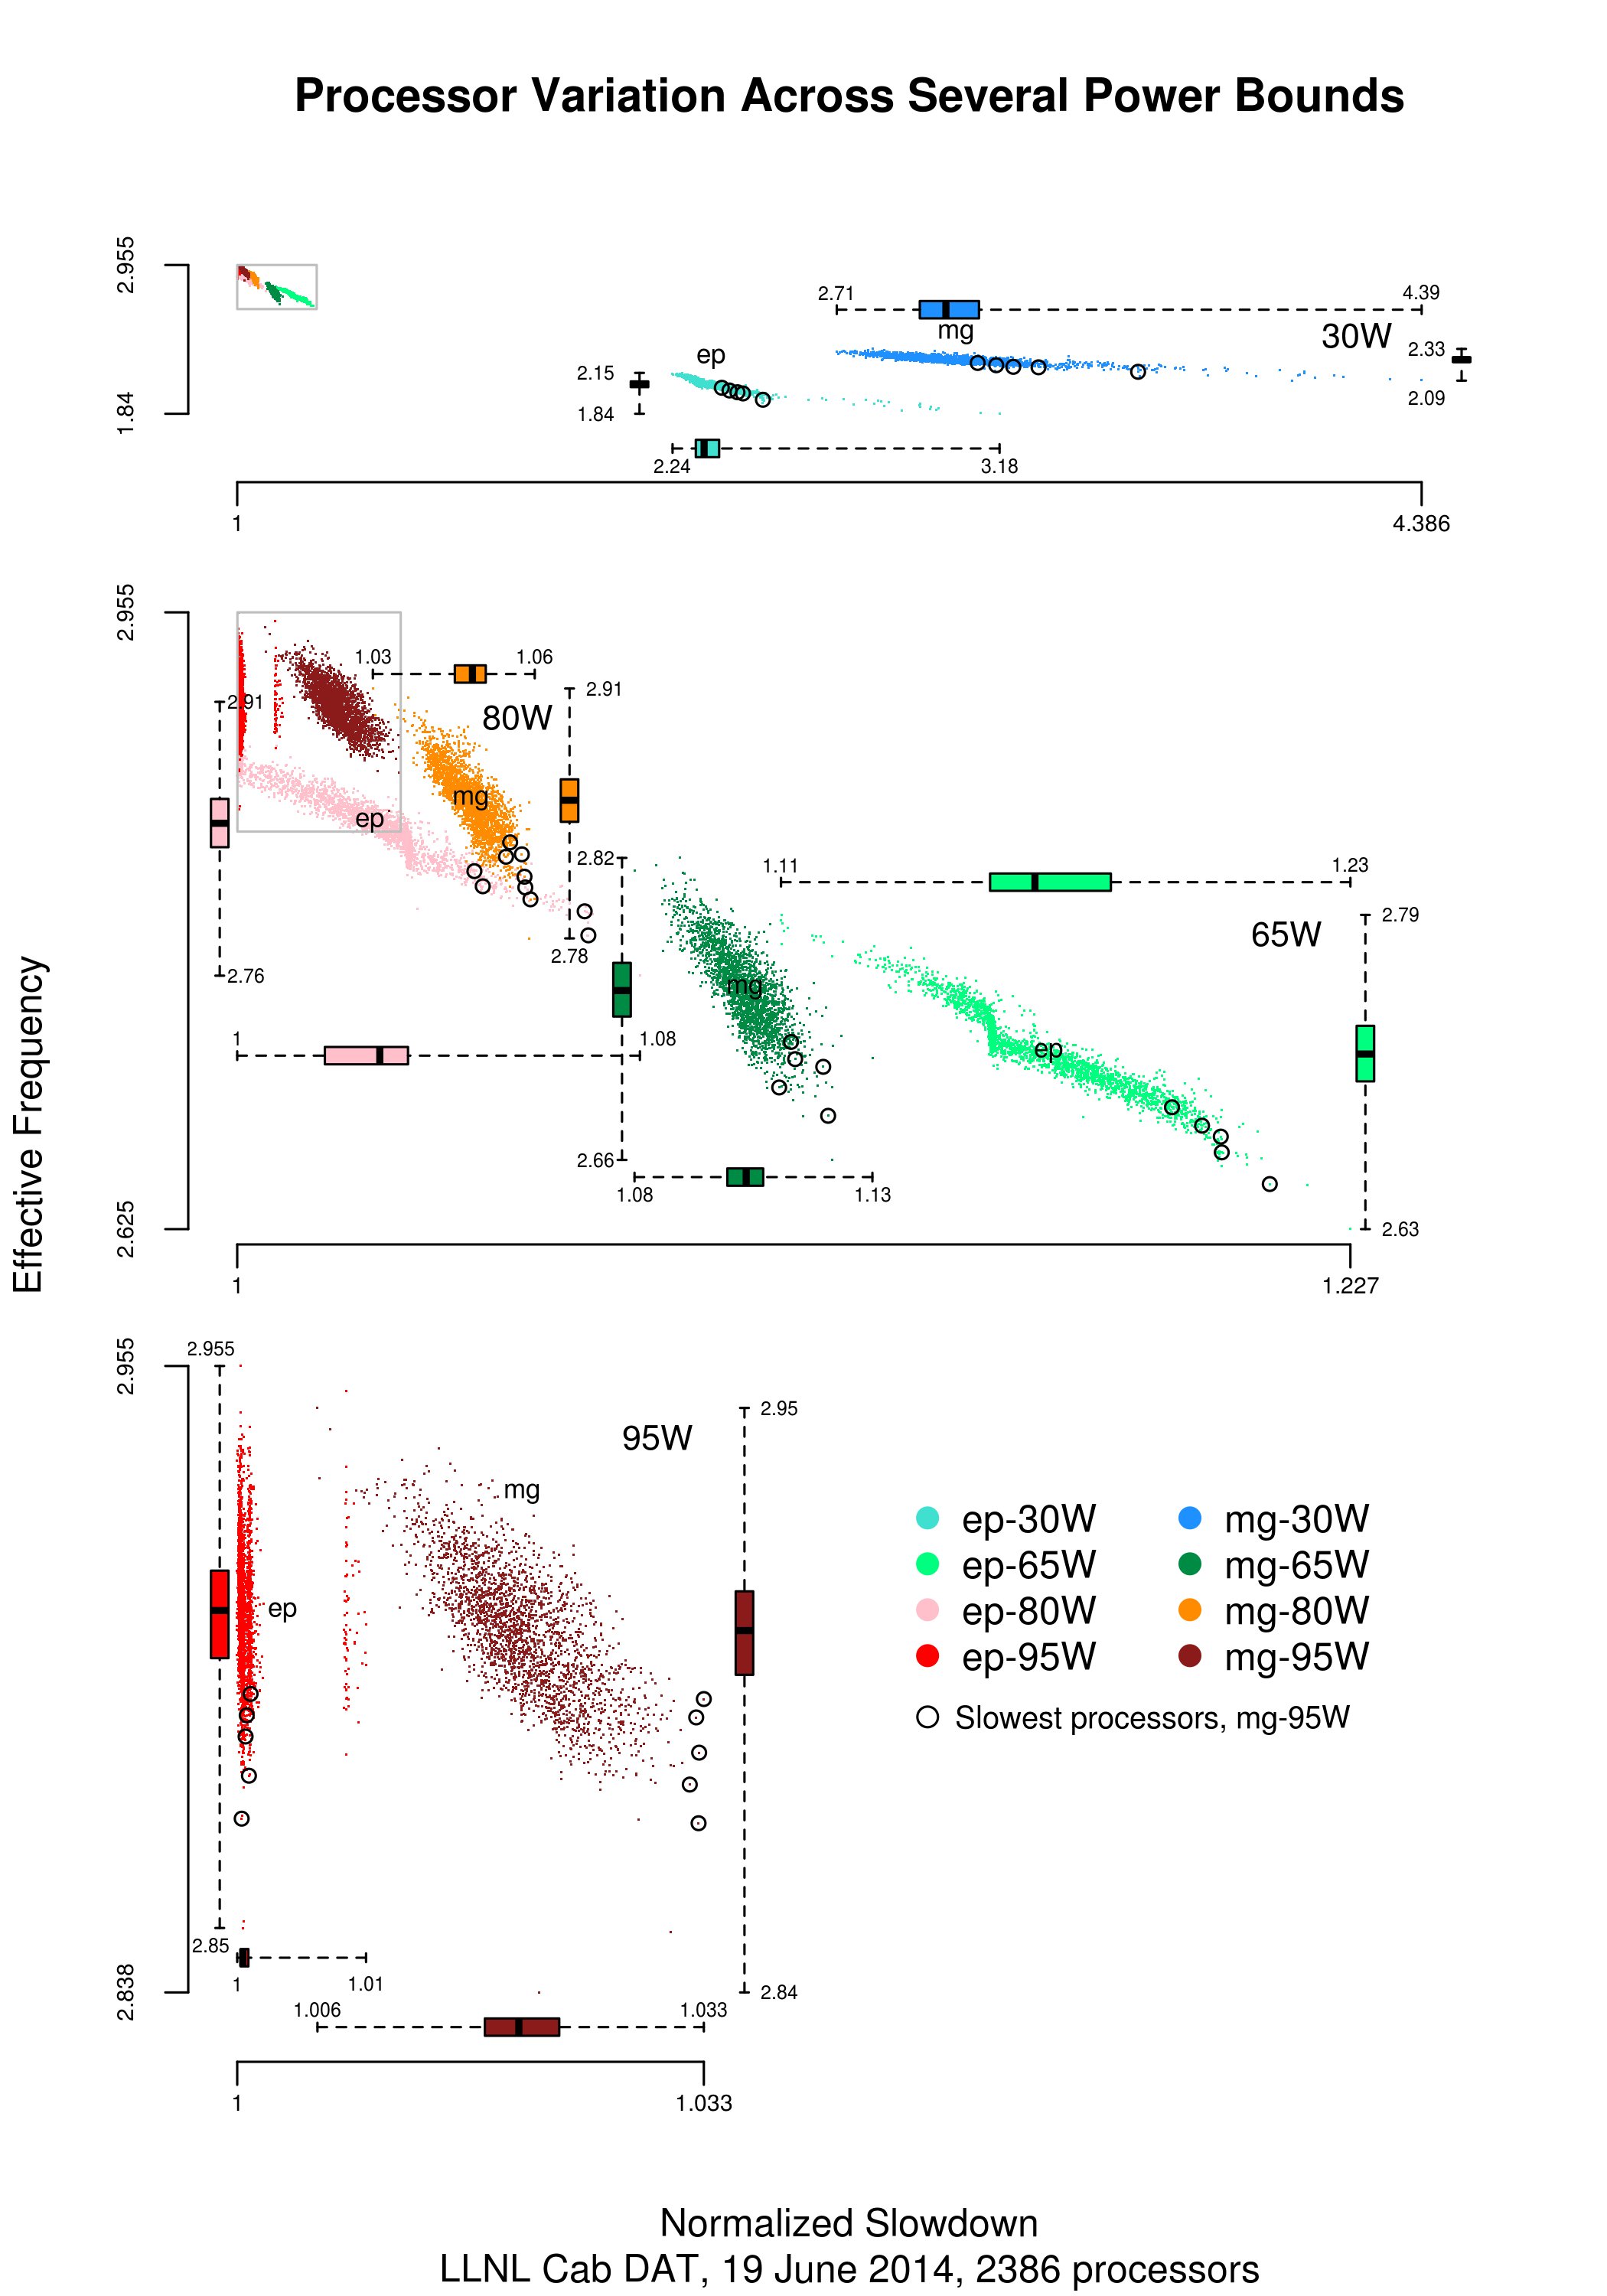
The following plot is in the slide deck and is included here as a teaser (i.e., more later). It shows data for 2,386 processors (x-axis is slowdown, y-axis clock frequency, top right legends max power), which thanks to Barry is now publicly available (or at least will be once some web details are sorted out).
Recent Comments