Archive
Computer: Plot the data
Last Saturday I attended my first 24-hour hackathon in over 5-years (as far as I know, also the first 24-hour hackathon in London since COVID); the GenAI Hackathon.
I had a great idea for the tool to build. Readers will be familiar with the scene in sci-fi films where somebody says “Computer: Plot the data”, and a plot appears on the appropriate screen. I planned to implement this plot-the-data app using LLMs.
The easy option is to use speech to text, using something like OpenAI’s Whisper, as a front-end to a conventional plotting program. The hard option is to also use an LLM to generate the code needed to create the plot; I planned to do it the hard way.
My plan was to structure the internal functionality using langchain tools and agents. langchain can generate Python and execute this code.
I decided to get the plotting working first, and then add support for speech input. With six lines of Python I created a program that works every now and again; here is the code (which assumes that the environment variable OPENAI_API_KEY has been set to a valid OpenAI API key; the function create_csv_agent is provided by langchain):
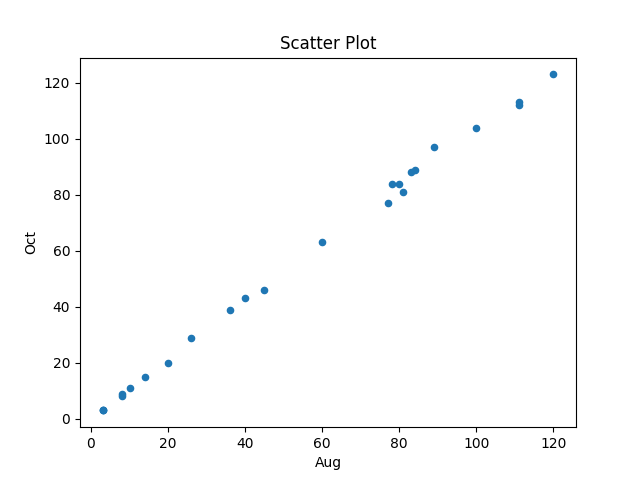
from langchain.agents import create_csv_agent from langchain.llms import OpenAI import pandas agent = create_csv_agent(OpenAI(temperature=0.0, verbose=True), "aug-oct_day_items.csv", verbose=True) agent.run("Plot the Aug column against Oct column.") |
Sometimes this program figures out that it needs to call matplotlib to display the data, sometimes its output is a set of instructions for how this plot functionality could be implemented, sometimes multiple plots appear (with lines connecting points, and/or a scatter plot).
Like me, and others, readers who have scratched the surface of LLMs have read that setting the argument temperature=0.0 ensures that the output is always the same. In theory this is true, but in practice the implementation of LLMs contains some intrinsic non-determinism.
The behavior can be made more consistent by giving explicit instructions (just like dealing with humans). I prefixed the user input instructions to use matplotlib, use column names as the axis labels, and to generate a scatter plot, finally a request to display the plot is appended.
In the following code, the first call to plot_data specifies the ‘two month columns’, and the appropriate columns are selected from the csv file.
from langchain.agents import create_csv_agent from langchain.llms import OpenAI import pandas def plot_data(file_str, usr_str): agent = create_csv_agent(OpenAI(temperature=0.0, model_name="text-davinci-003", verbose=True), file_str, verbose=True) plot_txt="Use matplotlib to plot data and" +\ " use the column names for axis labels." +\ " I want you to create a scatter " +\ usr_str + " Display the plot." agent.run(plot_txt) plot_data("aug-oct_day_items.csv", "plot using the two month columns.") plot_data("task-est-act.csv", "plot using the estimates and actuals.") plot_data("task-est-act.csv", "plot the estimates and actuals using a logarithmic scale.") |
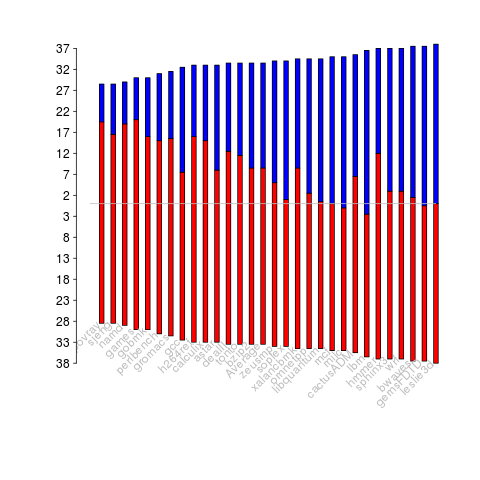
The first call to plot_data worked as expected, producing the following plot (code+data):
The second call failed with an ‘internal’ error. The generated Python has incorrect indentation:
IndentationError: unexpected indent (<unknown>, line 2) I need to make sure I have the correct indentation. |
While the langchain agent states what it needs to do to correct the error, it repeats the same mistake several times before giving up.
Like a well-trained developer, I set about trying different options (e.g., changing the language model) and searching various question/answer sites. No luck.
Finally, I broke with software developer behavior and added the line “Use the same indentation for each python statement.” to the prompt. Prompt engineering behavior is to explicitly tell the LLM what to do, not to fiddle with configuration options.
So now the second call to plot_data works, and the third call sometimes does odd things.
At the hack I failed to convince anybody else to work on this project with me. So I joined another project and helped out (they were very competent and did not really need my help), while fiddling with the Plot-the-data idea.
The code+test data is in the Plot-the-data Github repo. Pull requests welcome.
Hardware variability may be greater than algorithmic improvement
I’m giving a talk at COW 39 this week and it is more user friendly to include links in this summary than link to a pdf of the slides (which actually looks horrible).
Microelectronic fabrication has now reached the point where it etches and deposits handfuls of atoms (around 20 or so). One consequence of working with such a small number of atoms is that variations in the fabrication process (e.g., plus or minus a few atoms here and there) can have a significant impact on component characteristics, e.g., a transistor consumes more/less power or can be switched faster/slower. It might be argued that things will average out over the few hundred+ million components inside a device and that all devices will be essentially the same; measurements show that in practice there is a lot of variation across the devices.
Short version: Some properties of supposedly identical microelectronic devices now vary by around 10% and this variability is likely to get larger in the future.
Nearly all published papers involving computer system power measurement are based on measuring a single system. Many of the claimed algorithmic improvements are less than 10%, i.e., less than the expected variation in power consumption across supposedly identical devices/systems. These days any empirical paper involving power consumption has to include measurements from many devices/systems if any credibility is to be given to the findings.
The following measurement data has been found while researching for a book (code and data used for talk); a beta version of the pdf will be available for download real soon now.
The following plot shows feature size, in Silicon atoms, of released microprocessors. Data from Danowitz et al.

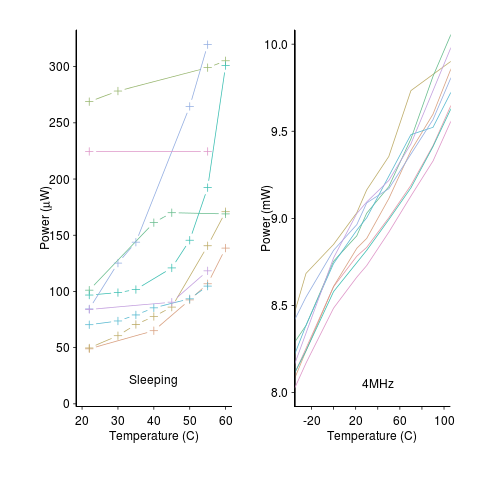
A study by Wanner, Apte, Balani, Gupta and Srivastava measured the power consumed by 10 separate Amtel SAM3U microcontrollers at various temperatures (embedded processors get used in a wide range of environments). The following plot shows how power consumption varied between processors at different temperatures when idling and executing. The relationship between the power characteristics of different processors changes with temperature; a large amount when idling and a little bit when executing.
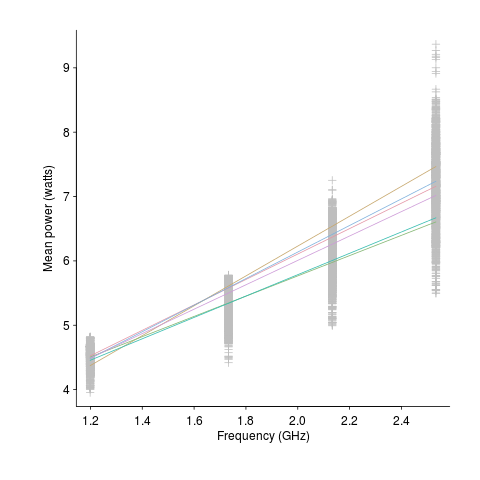
A study by Balaji, McCullough, Gupta and Agarwal measured the power consumption of six different Intel Core i5-540M processors, running at various frequencies, executing the SPEC2000 benchmark. The lines in the following plot were fitted to the data (grey crosses) using linear regression. The relationship between the power characteristics of different processors changes with clock frequency.
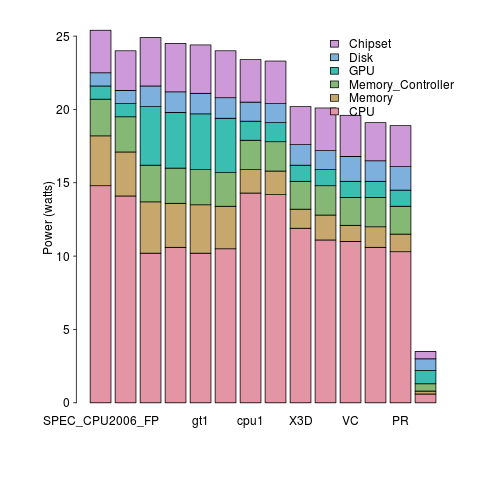
A study by Bircher measured power consumption of various system components, of an Intel server containing four Pentium 4 Xeons, when executing the SPEC CPU2006 benchmark. The power distribution for mobile devices would show the screen being the largest user of power, but I don’t have that data).
A study by Bircher measured memory (blue) and cpu (red) power consumption, in watts, executing the SPEC CPU2006 benchmarks. No point optimizig cpu power if over half the total power is consumed by memory.
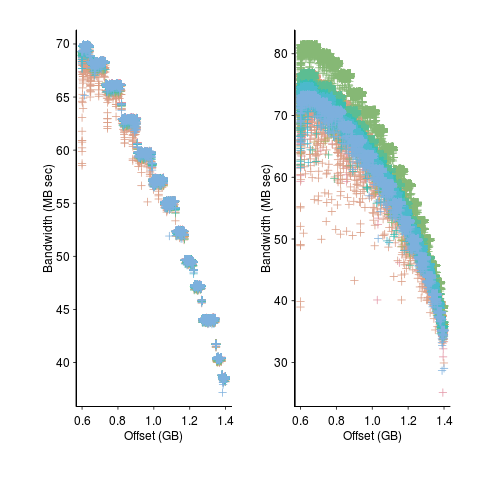
A study by Krevat, Tucek and Ganger measured the performance of then modern disk drives originally sold in 2002 (left) and 2006 (right). Different colors showing through on the right indicates that some discs have different performance characteristics than the others (faster performance -> less time -> less power, i.e., I don’t have power data for disk differences)
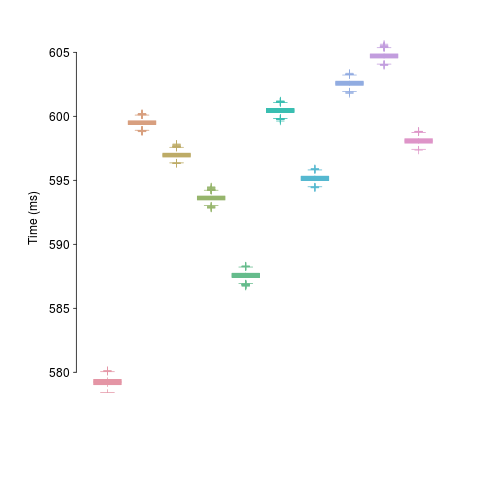
A study by Kalibera et al executed a benchmark 2,048 times followed by system reboot, repeated 10 times. Performance is consistent within a particular reboot, but not across them.
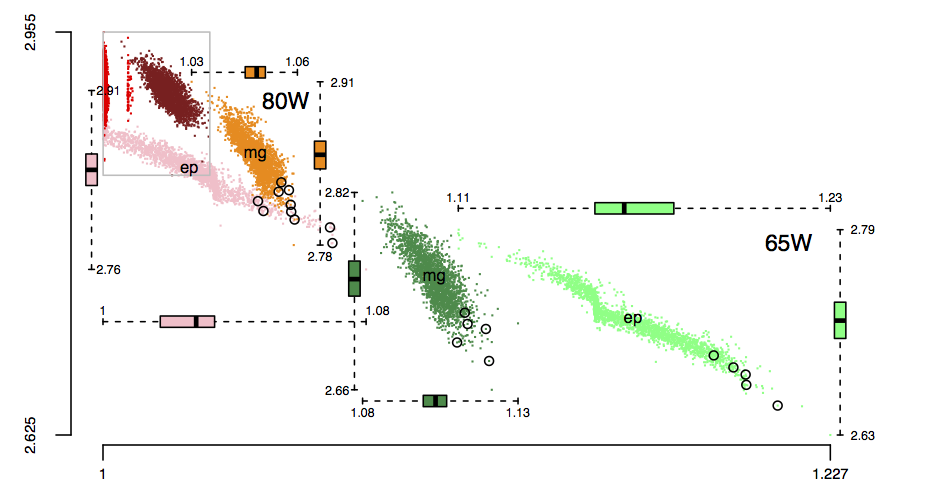
The following plot is in the slide deck and is included here as a teaser (i.e., more later). It shows data for 2,386 processors (x-axis is slowdown, y-axis clock frequency, top right legends max power), which thanks to Barry is now publicly available (or at least will be once some web details are sorted out).
Recent Comments