Archive
Christmas books for 2024
My rate of book reading has picked up significantly this year. The following are the really interesting books I read, as is usually the case, most were not published in this year.
I have enjoyed Grayson Perry’s TV programs on the art world, so I bought his book “Playing to the Gallery: Helping Contemporary Art in its Struggle to Be Understood“. It’s a fun, mischievous look at the art world by somebody working as a traditional artist, in the sense of creating work that they believe means/says something, rather than works that are only considered art because they are displayed in an art gallery.
“The Computer from Pascal to von Neumann” by H. H. Goldstine. This history of computing from the mid-1600s (the time of Blaise Pascal) to the mid-1900s (von Neumann died in 1957) told by a mathematician who was first involved in calculating artillery firing tables during World War II, and then worked with early computers and von Neumann. This book is full of insights that only a technical person could provide and is a joy to read.
I saw a poster advertising a guided tour of the trees in my local park, organized by Trees for Cities. It was a very interesting lunchtime; I had not appreciated how many different trees were growing there, including three different kinds of Oak tree. Trees for Cities run events all over the UK, and abroad. Of course, I had to buy some books to improve my tree recognition skills. I found “Collins tree guide” by O. Johnson and D. More to be the most useful and full of information. Various organizations have created maps of trees in cities around the world. The London Tree Map shows the location and species information for over 880,000 of trees growing on streets (not parks), New York also has a map. For a general analysis of patterns of tree growth, see “How to Read a Tree” by T. Gooley.
“Medieval Horizons: Why the Middle Ages Matter” by I. Mortimer. This book takes the reader through the social, cultural and economic changes that happened in England during the Middle Ages, which the author specifies as the period 1000 to 1600. I knew that many people were surfs, but did not know that slaves accounted for around 10% of the population, dropping to zero percent during this period. Changes, at least for the well-off, included moving from living in longhouses to living in what we would call a house, art works moved from two-dimensional representations to life-like images (e.g., renaissance quality), printing enables an explosion of books, non-poor people travelled more, ate better, and individualism started to take-off.
Statistical Consequences of Fat Tails: Real World Preasymptotics, Epistemology, and Applications by N. N. Taleb is a mathematically dense book (while the pdf is in color, I was disappointed that the printed version is black/white; this is the one I read while travelling). This book tells you a lot more than you need to know about the consequences of fat tail distributions. Why might you be interested in the problems of fat tails? Taleb starts by showing how little noise it takes for the comforting assumptions implied by the Normal/Gaussian distribution to fly out the window. The primary comforting assumptions are that the mean and variance of a small sample are representative of the larger population. A world of fat tail distributions is one where the unexpected is to be expected, where a single event can wipe out an organization or industry (banks are said to have lost more in the 2008 financial crisis than they had made in the previous many decades). This book is hard going, and I kept at it to get a feel for the answers to some of the objections to the bad news conveyed. There are a couple of places where I should have been more circumspect in my Evidence-based software engineering book.
I have previously reviewed General Relativity: The Theoretical Minimum by Susskind and Cabannes.
“Embracing Defeat: Japan in the Wake of World War II” by John W. Dower describes in harrowing detail the dire circumstances of the population of Japan immediately after World War II and what they had to endure to survive.
For more detailed book reviews, see: Mr. and Mrs. Psmith’s Bookshelf with some excellent and insightful long book reviews, and the annual Astral Codex Ten book review contest usually has a few excellent reviews/books.
For those of you who think that civilization is about to collapse, or at least like talking about the possibility, a reading list. At the practical level, I think sword fighting and archery skills are more likely to be useful in the longer term.
Polished statistical analysis chapters in evidence-based software engineering
I have completed the polishing/correcting/fiddling of the eight statistical analysis related chapters of my evidence-based software engineering book, and an updated draft pdf is now available (download here).
The material was in much better shape than I recalled, after abandoning it to the world 2-years ago, to work on the software engineering chapters.
Changes include moving more figures into the margin (which is responsible for a lot of the reduction in page count), fixing grammatical typos, removing place-holders for statistical techniques that are unlikely to be of general interest to software engineers, and mostly minor shuffling around (the only big change was moving a lot of material from the Experiments chapter to the Statistics chapter).
There is still some work to be done, in places (most notably the section on surveys).
What next? My collection of data waiting to be analysed has been piling up, so I will spend the next month reducing the backlog.
The six chapters covering the major areas of software engineering need to be polished and fleshed out, from their current bare-bones state. All being well, this time next year a beta release will be ready.
While working on the statistical material, I have been making monthly updates to the pdf+data available. If it makes sense to do this for the rest of the material, then it will happen. I’m not going to write a blog post every month; perhaps a post after what look like important milestones.
As always, if you know of any interesting software engineering data, please tell me.
Practical statistics books for software engineers
So you have read my (draft) book on evidence-based software engineering and want to learn more about the statistical techniques used, but are not interested lots of detailed mathematics. What books do I suggest?
All the following books are sitting on the shelf next to where I write (not that they get read that much these days).
Before I took the training wheels off my R usage, my general go to book was (I still look at it from time to time): “The R Book” by Crawley, second edition; “R in Action” by Kabacoff is a good general read.
In alphabetical subject order:
Categorical data: “Categorical Data Analysis” by Agresti, the third edition is a weighty tomb (in content and heaviness). Plenty of maths+example; more of a reference.
Compositional data: “Analyzing compositional data with R” by van den Boogaart and Tolosana-Delgado, is more or less the only book of its kind. Thankfully, it is quite good.
Count data: “Modeling count data” by Hilbe, may be more than you want to know about count data. Readable.
Circular data: “Circular statistics in R” by Pewsey, Neuhauser and Ruxton, is the only non-pure theory book available. The material seems to be there, but is brief.
Experiments: “Design and analysis of experiments” by Montgomery.
General: “Applied linear statistical models” by Kutner, Nachtsheim, Neter and Li, covers a wide range of topics (including experiments) using a basic level of mathematics.
Machine learning: “An Introduction to Statistical Learning: with Applications in R” by James, Witten, Hastie and Tibshirani, is more practical (but not dumbed down, like some) and less maths (a common problem with machine learning books, e.g., “The Elements of Statistical Learning”). Watch out for the snake-oil salesmen using machine learning.
Mixed-effects models: “Mixed-effects models in S and S-plus” by Pinheiro and Bates, is probably the book I prefer; “Mixed effects models and extensions in ecology with R” by Zuur, Ieno, Walker, Saveliev and Smith, is another view on an involved topic (plus lots of ecological examples).
Modeling: “Statistical rethinking” by McElreath, is full of interesting modeling ideas, using R and Stan. I wish I had some data to try out some of these ideas.
Regression analysis: “Applied Regression Analysis and Generalized Linear Models” by Fox, now in its third edition (I also have the second edition). I found this the most useful book, of those available, for a more detailed discussion of regression analysis. Some people like “Regression modeling strategies” by Harrell, but this does not appeal to me.
Survival analysis: “Introducing survival and event history analysis” by Mills, is a readable introduction covering everything; “Survival analysis” by Kleinbaum and Klein, is full of insights but more of a book to dip into.
Time series: The two ok books are: “Time series analysis and its application: with R examples” by Shumway and Stoffler, contains more theory, while “Time series analysis: with applications in R” by Cryer and Chan, contains more R code.
There are lots of other R/statistics books on my shelves (just found out I have 31 of Springer’s R books), some ok, some not so. I have a few ‘programming in R’ style books; if you are a software developer, R the language is trivial to learn (its library is another matter).
Suggestions for books covering topics I have missed welcome, or your own preferences (as a software developer).
Statistical techniques not needed to analyze software engineering data
One of the methods I used to try to work out what statistical techniques were likely to be useful to software developers, was to try to apply techniques that were useful in other areas. Of course, applying techniques requires the appropriate data to apply them to.
Extreme value statistics are used to spot patterns in rare events, e.g., frequency of rivers over spilling their banks and causing extensive flooding. I have tried and failed to find any data where Extreme value theory might be applicable. There probably is some such data, somewhere.
The fact that I have spent a lot of time looking for data and failed to find particular kinds of data, suggests that occurrences are rare. If data needing a particular kind of analysis technique is rare, there is no point including a discussion of the technique in a book aimed at providing general coverage of material.
I have spent some time looking for data drawn from a zero-inflated Poisson distribution. Readers are unlikely to have ever heard of this and might well ask why I would be interested in such an obscure distribution. Well, zero-truncated Poisson distributions crop up regularly (the Poisson distribution applies to count data that starts at zero, when count data starts at one the zeroes are said to be truncated and the Poisson distribution has to be offset to adjust for this). There is a certain symmetry to zero-truncated/inflated (although the mathematics involved is completely different), plus there is probably a sunk cost effect (i.e., I have spent time learning about them, I am going to find the data).
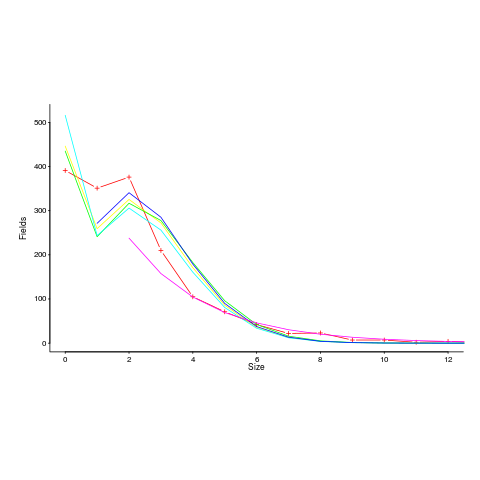
I spotted a plot in a paper investigating record data structure usage in Racket, that looked like it might be well fitted by a zero-inflated Poisson distribution. Tobias Pape kindly sent me the data (number of record data structures having a given size), which I then failed miserably to fit to any kind of Poisson related distribution; see plot below; data points along red line through the plus symbols (code+data):
I can only imagine what the authors thought of my reason for wanting the data (I made data requests to a few other researchers for similar reasons; and again I failed to fit the desired distribution).
I had expected to make more use of time series analysis; but, it has just not been that applicable.
Machine learning is useful for publishing papers, but understanding what is going on is the subject of my book, not building black boxes to make predictions.
It is possible that researchers are not publishing work relating to data that requires statistical techniques I have not used, because they don’t know how to analyze the data or the data is too hard to collect. Inability to use the correct techniques to analyze data is rarely a reason for not publishing a paper. Data being too hard to collect is very believable, as-is the data rarely occurring in software engineering related work.
There are statistical tests I have intentionally ignored, the Mann–Whitney U test (aka, the Wilcoxon rank-sum test) and the t-test probably being the most well-known. These tests became obsolete once computers became generally available. If you are ever stuck on a desert island without a computer, these are the statistical tests you will have to use.
What statistical techniques are useful for software engineering data?
What statistical techniques are of general usefulness for analyzing software engineering data?
The answer depends on the kinds of data likely to be encountered, in software engineering, and the questions likely to be asked.
When I started working on a book, aiming to cover all worthwhile publicly available software engineering data, I was hoping to refer readers to a book (or two) that they ought to read to learn the appropriate techniques. Kabacoff’s “R in Action” comes closest to the book I had in mind as a basic introduction, but there was nothing covering a wider range of topics; so I ended up writing something; I found Crawley’s “The R book”, to be the best book on the subject.
My answer to the kinds of data likely to be available was to work with all the software engineering data I could get obtain (around 600 data sets to date).
What questions should be asked about the data? My selection of questions was driven by whether the data was used in the software engineering half of the book, or the statistical analysis techniques half.
The software engineering material consists of the chapters: Introduction, Human cognitive characteristics, Cognitive capitalism, Ecosystems, Projects, Reliability and Source code. The data appeared in one of these chapters if it could be used to make (what I thought was) a practical point about the topic being discussed.
Data appeared in the statistical analysis techniques chapters, if it could be used to illustrate the technique under discussion.
What happened in practice was the software engineering material was worked on for a year or two, on realizing that bespoke statistical analysis material was needed the existing data was plundered to create the necessary chapters; after this was released, work switched back to the software engineering material (using unplundered and newly acquired data), and of course the earlier chapters plundered data from the yet to be worked on chapters.
This seems to have worked surprisingly well, at least from my perspective of keeping the production line going.
Now most if the data has been analyzed, it’s time to take a global overview and where necessary shuffle things around. I may find that everything is a complete mess; we shall see.
What techniques have I found to be useful?
The number 1, most useful data analysis technique is building a regression model. The one thing I have been consistently able to do, when analyzing other people’s data, is extract more information from it than they did (unless they also built a regression model); at times it has been embarrassing.
At number 2, is bootstrapping. Many widely used techniques only give accurate answers if the data has a normal/gaussian distribution and use of these techniques can involve a lot of arm waving involving claims about the data having a good-enough gaussian-like distribution. This arm waving was necessary before computers became available, because the practical manual techniques required a gaussian distribution. Now we have computers and techniques that don’t require any particular distribution can be used, and which in some cases are more powerful techniques than those designed for manual implementation.
Sitting here, I cannot think of a number 3; there might be one.
What techniques are not generally useful? The various tests containing some combination of the names Wilcoxon, Mann and Whitney are well past their sell-by date. Searching the source of the book I see these names still appear in one or two places; this is a hangover from the early versions from many years ago (when I was following the clueless herd) and will soon be gone.
I thought that extreme value theory might apply to some data, but have only found one data-set to which it might be applied (so not generally useful).
I spent a lot of time watching out for zero-inflated data (data containing more zero values than expected by the common probability distributions). I saw four/five papers containing plots of data that looked zero-inflated and emailed the authors asking for the data (who kindly sent it to me). None of the data turned out to be zero-inflated (I’m not sure what the authors thought about being asked for data that somebody thought was zero-inflated). This does not mean that software engineering data is not zero-inflated, only that it is not common.
My zero-inflated search was motivated by the occasional appearance of zero-truncated data (data with that does not contain zero values). Zero-truncated data occurs when counting starts at one, rather than zero (I have one data-set that is 0/1 truncated; the counting starts at 2).
I was surprised that time-series did not turn out to be widely useful.
Sometimes we are all clueless button pushers, so machine learning gets a few pages. Anybody who knows what they are doing builds regression models.
I will eventually get around to counting how many times each technique is used on the data I have (watch this blog, but don’t hold your breath).
Ways of obtaining empirical data in software engineering
For as long as I can remember I have been a collector of empirical data. Writing a book that involves analysis of empirical lots of data has added some focus to my previous scatter gun approach. I have been using three methods to obtain data relating to a recently read paper+one other approach:
- Download from researchers website,
- Emailing the author requesting a copy of the data,
- Reverse engineering numbers from the original paper (using tools like WebPlotDigitizer).
- Roll my sleeves up and do the experiment, write the extraction tool or convince a company to make its data available.
A sea change in attitudes to making data available seems to be underway. Until recently it was rare to find a researcher who provided a link for downloading data; in the last 12 months there has been a noticeable increase in the number of researchers making data, associated with a paper, available for download. I hope this increase continues and making data freely available becomes the accepted norm.
I regularly (once or twice a week) email the authors of a paper asking if I can have a copy of their data, typical responses include:
- Yes, here it is,
- Yes, but you cannot share it with anybody else (i.e., everybody has to get it from the original author). I have said “Thanks, but no thanks” in these cases since I make all the data I use freely available for download,
- I no longer have a copy of the data (changed jobs, lost in a computer crash, etc). In one case an established repository at a university lost funding and has gone dark.
- Data is confidential,
- Plan to write more papers based on the data, will release it when done (obtaining good data can be very time consuming and I can appreciate researchers wanting to maximize their return on investment),
- No response.
I have run a few experiments and have been luck enough to obtain data from one company.
When analysing data the most common ‘mistake’ I encounter is researchers failing to get the most out of the data they have. An example of this is two researchers who made some structural changes to the way a Java library worked and then ran a thorough before/after benchmark to investigate the impact; their statistical analysis consisted of reducing the extensive data down to mean+variance and comparing these across before/after (I built a regression model that makes a much stronger case for their claims).
Of course the usual incorrect use of statistical techniques does occur, but I have not spotted anything major. However, one study found: Willingness to Share Research Data Is Related to the Strength of the Evidence and the Quality of Reporting of Statistical Results, based on 49 papers published in two major psychology journals. Since I am concentrating on papers where the data is available I am probably painting an overly rosy picture of not getting things wrong.
As always, if anybody knows of ways of obtaining data that I have not mentioned (e.g., a twitter account to follow) do please let me know.
Learning R as a language
Books written to teach a general purpose programming language are usually organized according to the features of the language and examples often show how a particular language feature is interpreted by a compiler. Books about domain specific languages are usually organized in a way that makes sense in the corresponding application domain and examples usually illustrate how a particular domain problem can be solved using the language.
I have spent a lot of time using R over the last year and by dint of reading lots of R code and various introductions to the language I have managed to piece together a model of the language. I rarely have any trouble learning a general purpose language from its reference manual, but users of domain specific languages are rarely interested in language details and so these reference manuals are usually only intended to be read by people who know the language well (another learning problem is that domain specific languages often contain quirky features rarely seen in other languages; in the case of R I was not lucky enough to know enough other languages to cover all its quirky features).
I managed to one introduction to R written from the perspective of the programming language (and not the application domain): the original The Art of R Programming by Norman Matloff has been expanded and is now available as a book.
Summary. If you know another language and want to quickly learn about the languages features of R I recommend this book. I have not taught raw beginners for over 30 years and have no idea if this book would be of any use to them.
This book does not attempt to teach you to think ‘R’, it is not about the art of R programming. The value of this book is as a single source for a broad coverage of lots of language features explained using lots of examples. Yes, more time could have been spent on the organization and fixing inconsistencies in the layout; these are not show stoppers.
Some people might tell you to buy “Software for Data Analysis” by John Chambers. Don’t; if you are a fan of Finnegans Wake and are nostalgic for the mainframe world of the 1970s you might like to give it a go. (I think Bertrand Meyer’s “Object-oriented Software Construction” is still the best book about the design of a language).
Meanderings. What books are good examples of “The Art of …” writing for domain specific languages? Two that spring to mind are: “Algorithms in Snobol 4” by James Gimpel (still spotted from time to time on second hand book sites) and more recently “SQL For Smarties: Advanced SQL Programming” by Joe Celko.
Yes, I know that R is not really a domain specific language but a language that is primarily used in one domain. Frink is an example of a language containing a major behavior feature that is specific to its intended application domain. I cannot think of any major language feature of R that is specific to statistics.
Recent Comments