Archive
AEC hackathon: what do the coloured squiggles mean?
I was at the AEC hackathon last weekend. There were a whole host of sponsors, but there was talk of project sponsorship for teams trying to solve a problem involving London’s Crossrail project. So most of those present were tightly huddled around tables, intently whispering to each other about their crossrail hack (plenty of slide-ware during the presentations).
I arrived at hacker time (a bit later than all the keen folk who had been waiting outside for the doors to open from eight’ish) and missed out on forming a team. Talking to Nik and Geoff, from the Future Cities Catapult (one of the sponsors), I learned about the 15 sensor packages that had been distributed around the building we were in (Intel Photon+Smartcitizen sensor kits, connected via the local wifi).
These sensors had been registered with the Smart Citizen platform and various environmental measurements, around each sensor, was being recorded at 1 minute resolution. The sensors had been set up a few days earlier, so only recent data was available.
The Smart Citizen dashboard provided last recorded values and a historical plot for each sensor on its own (example here). The Future Cities guys wanted something a bit more powerful, and team Coloured Squiggles set to work (one full time member, plus anyone who dawdled within conversation range).
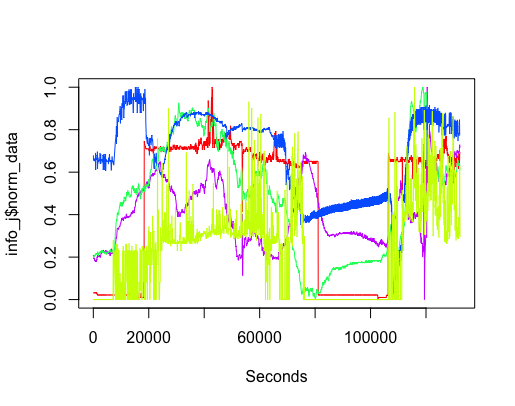
It did not take long, using R, to extract and plot the data from various sensors (code). The plot below shows just over a days worth of data from the sensor installed in the basement (where the hackathon took place). The red line is ambient light (which is all internal because we are underground), yellowish is sound level (the low level activity before the lights come on is air-conditioning switching on ready for Friday morning, there is no such activity for Saturday morning), blue is carbon monoxide (more about that later), green is nitrogen dioxide and purple is humidity. Values have been normalised.
The interesting part of the project was interpreting the squiggly lines; what was making them go up and down. Nik was a great source of ideas and being involved with setting the sensors up knew about the kind of environment they were in, e.g., basement, by the window (a source of light) and on top of the coffee machine (which was on a fridge, whose cooling motor on/off cycling we eventually decided was causing the periodic nighttime spikes in the sound level seen in yellow below {ignore the x-axis values}).
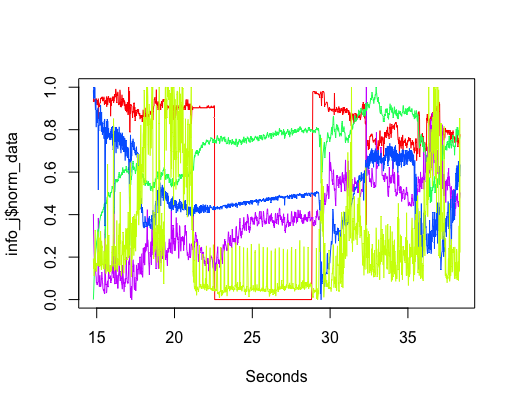
The variation in the level of Carbon-Monoxide was discussed a lot. IoT sensors are very low cost and so it is easy to question the quality of their output. However, all sensors showed this same pattern of behavior, although some contained more noise than others (compare the thickness of the blue lines in the above plots). One idea was that CO is heavier than air and sinks to the floor at night and gets stirred up in the morning, but Wikipedia says it is not heavier than air. Another idea was that the air-conditioning allows fresh outside into the building in the morning, which gets gradually gets filtered.
The lessons learned was that a sensor’s immediate environment can cause all sorts of unexpected variation in its output. The only way to figure out what is going on is by walking round talking to the people who occupy the same space as the sensor.
The final version provided a browser based interface, allowing individual devices and multiple sensor output to be selected (everything is on github).
Been invaded by mysterious sounds? You need SoundHound
Team SoundHound (Gary, Pavel and yours truly) were at the Intel Hardware Hackathon last weekend. Hardware hacks are about the peripherals that are available on the day; I grabbed one of everything and we all sat down to play with them and come up with a great gadget to build. At an Intel sponsored event the computers are obviously Galileo and Edison (which is what we ended up using).
The Intel guys had a very fixed idea about how the hackathon was to run and specified that eight projects had to be proposed and selected (by everybody present) on the Friday night and that these would be worked on over the weekend (but we were allowed to change the idea; the logic escaped me). I proposed a vibration detection project to measure the impact of passing vehicles on houses next to busy roads. Nobody on what was to become SoundHound thought this was a great idea, but it was the only idea we had and there was nothing stopping us radically changing our mind over the weekend.
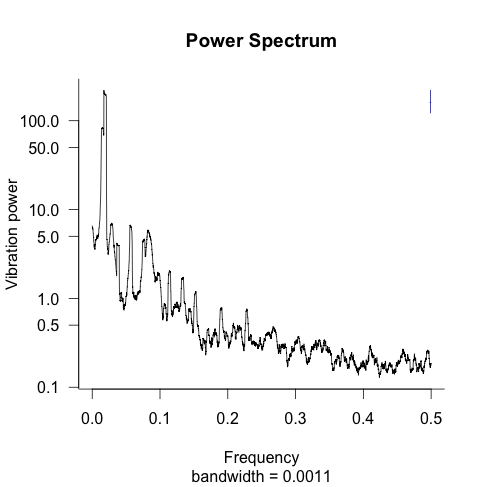
Vehicles generate sound which we can hear, but buildings are damaged by the lower frequency vibrations that we sometimes feel but don’t usually hear. A microphone would be useless, what was needed was a vibration sensor and a packet of piezo vibration sensors, the SEN-09198, was provided. We did not have any amplifiers to boost the signal, so the sensors were wired directly onto the signal pins; this meant that the dynamic range of the signal was about 50 times smaller than the input could handle and our test vibrations were created by banging on the table on which the sensor sat (power spectrum of me doing just that below).
We worked away on the vehicle vibration idea waiting for something better to come along. Some household appliances contain motors that cause them to vibrate, perhaps we could detect these vibrations. The use case here was a fridge next to a wall transmitting vibration into another room which then generated a hard to pin-down noise in that room. Around this time it occurred to us that a ghost detector (everybody knows that walls vibrate when ghosts travel through them) might be a bigger market, after all occult books sell well.
IBM were an event sponsor and had people on-hand to help us set up and use Bluemix, their cloud offering. The Edison board was communicating with our laptops via wifi and this got rerouted so the data was sent to IBM’s cloud storage. Collecting everybodies vibration data meant we could do pattern matching on the power spectrum of the vibration to identify candidates for the device most likely to be generating it (whether the vibration characteristics of different devices is sufficiently different for the pattern matching to be able to distinguish them at some useful level is another matter; I imagine that the shape of a fridge causes its vibration to modulate slightly from the frequency of the local electricity supply).
One of the problems of producing a working demo at a hackathon is being held to a much higher standard of reality. Teams whose output is slideware illustrating the tenuous connection its members have to reality don’t seem to have any trouble getting unquestioning agreement that anything they propose will just work. We were asked how we would obtain the vibration data for different household devices, against which the customer data could be compared; a marketing type capable of convincingly talking about our crowd source solution would have been useful.
Late Saturday afternoon saw team SoundHound out on the streets measuring vehicle vibration. Unfortunately large lorries traveling at speed are thin on the ground in central London, also guys standing next to a laptop with wires attached to something on the ground filming everything that went past had the effect of causing drivers to slow down to low vibration speeds (rather than speeding up to get away from us).
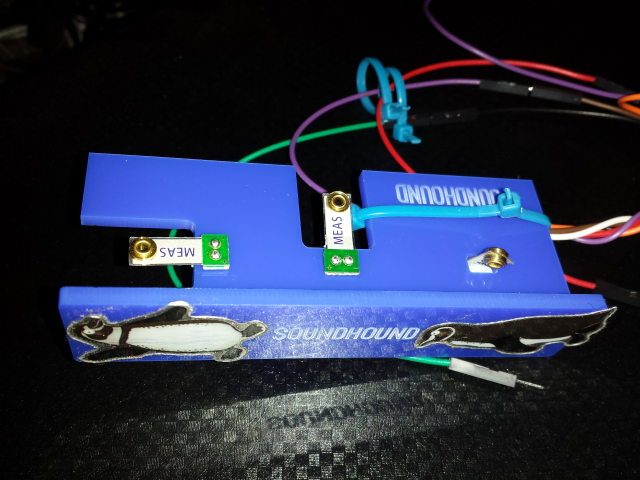
Perhaps we should have gone with the ghost detector sale pitch. The cloud data storage could have been rebranded as The Ethereum data matrix and flashing leds added to the hand-held sensor (the penguins below send the wrong message).
If it is possible to distinguish home appliances based on their vibration characteristics, and a database is created, there is an opportunity for salesmen to systematically check each house/flat ‘listening’ for appliances that are close to failing (motors vibrate more as they wear out): “Hello Sir, your fridge/boiler/air-conditioning is getting old and this week we have a special offer on replacements…”.
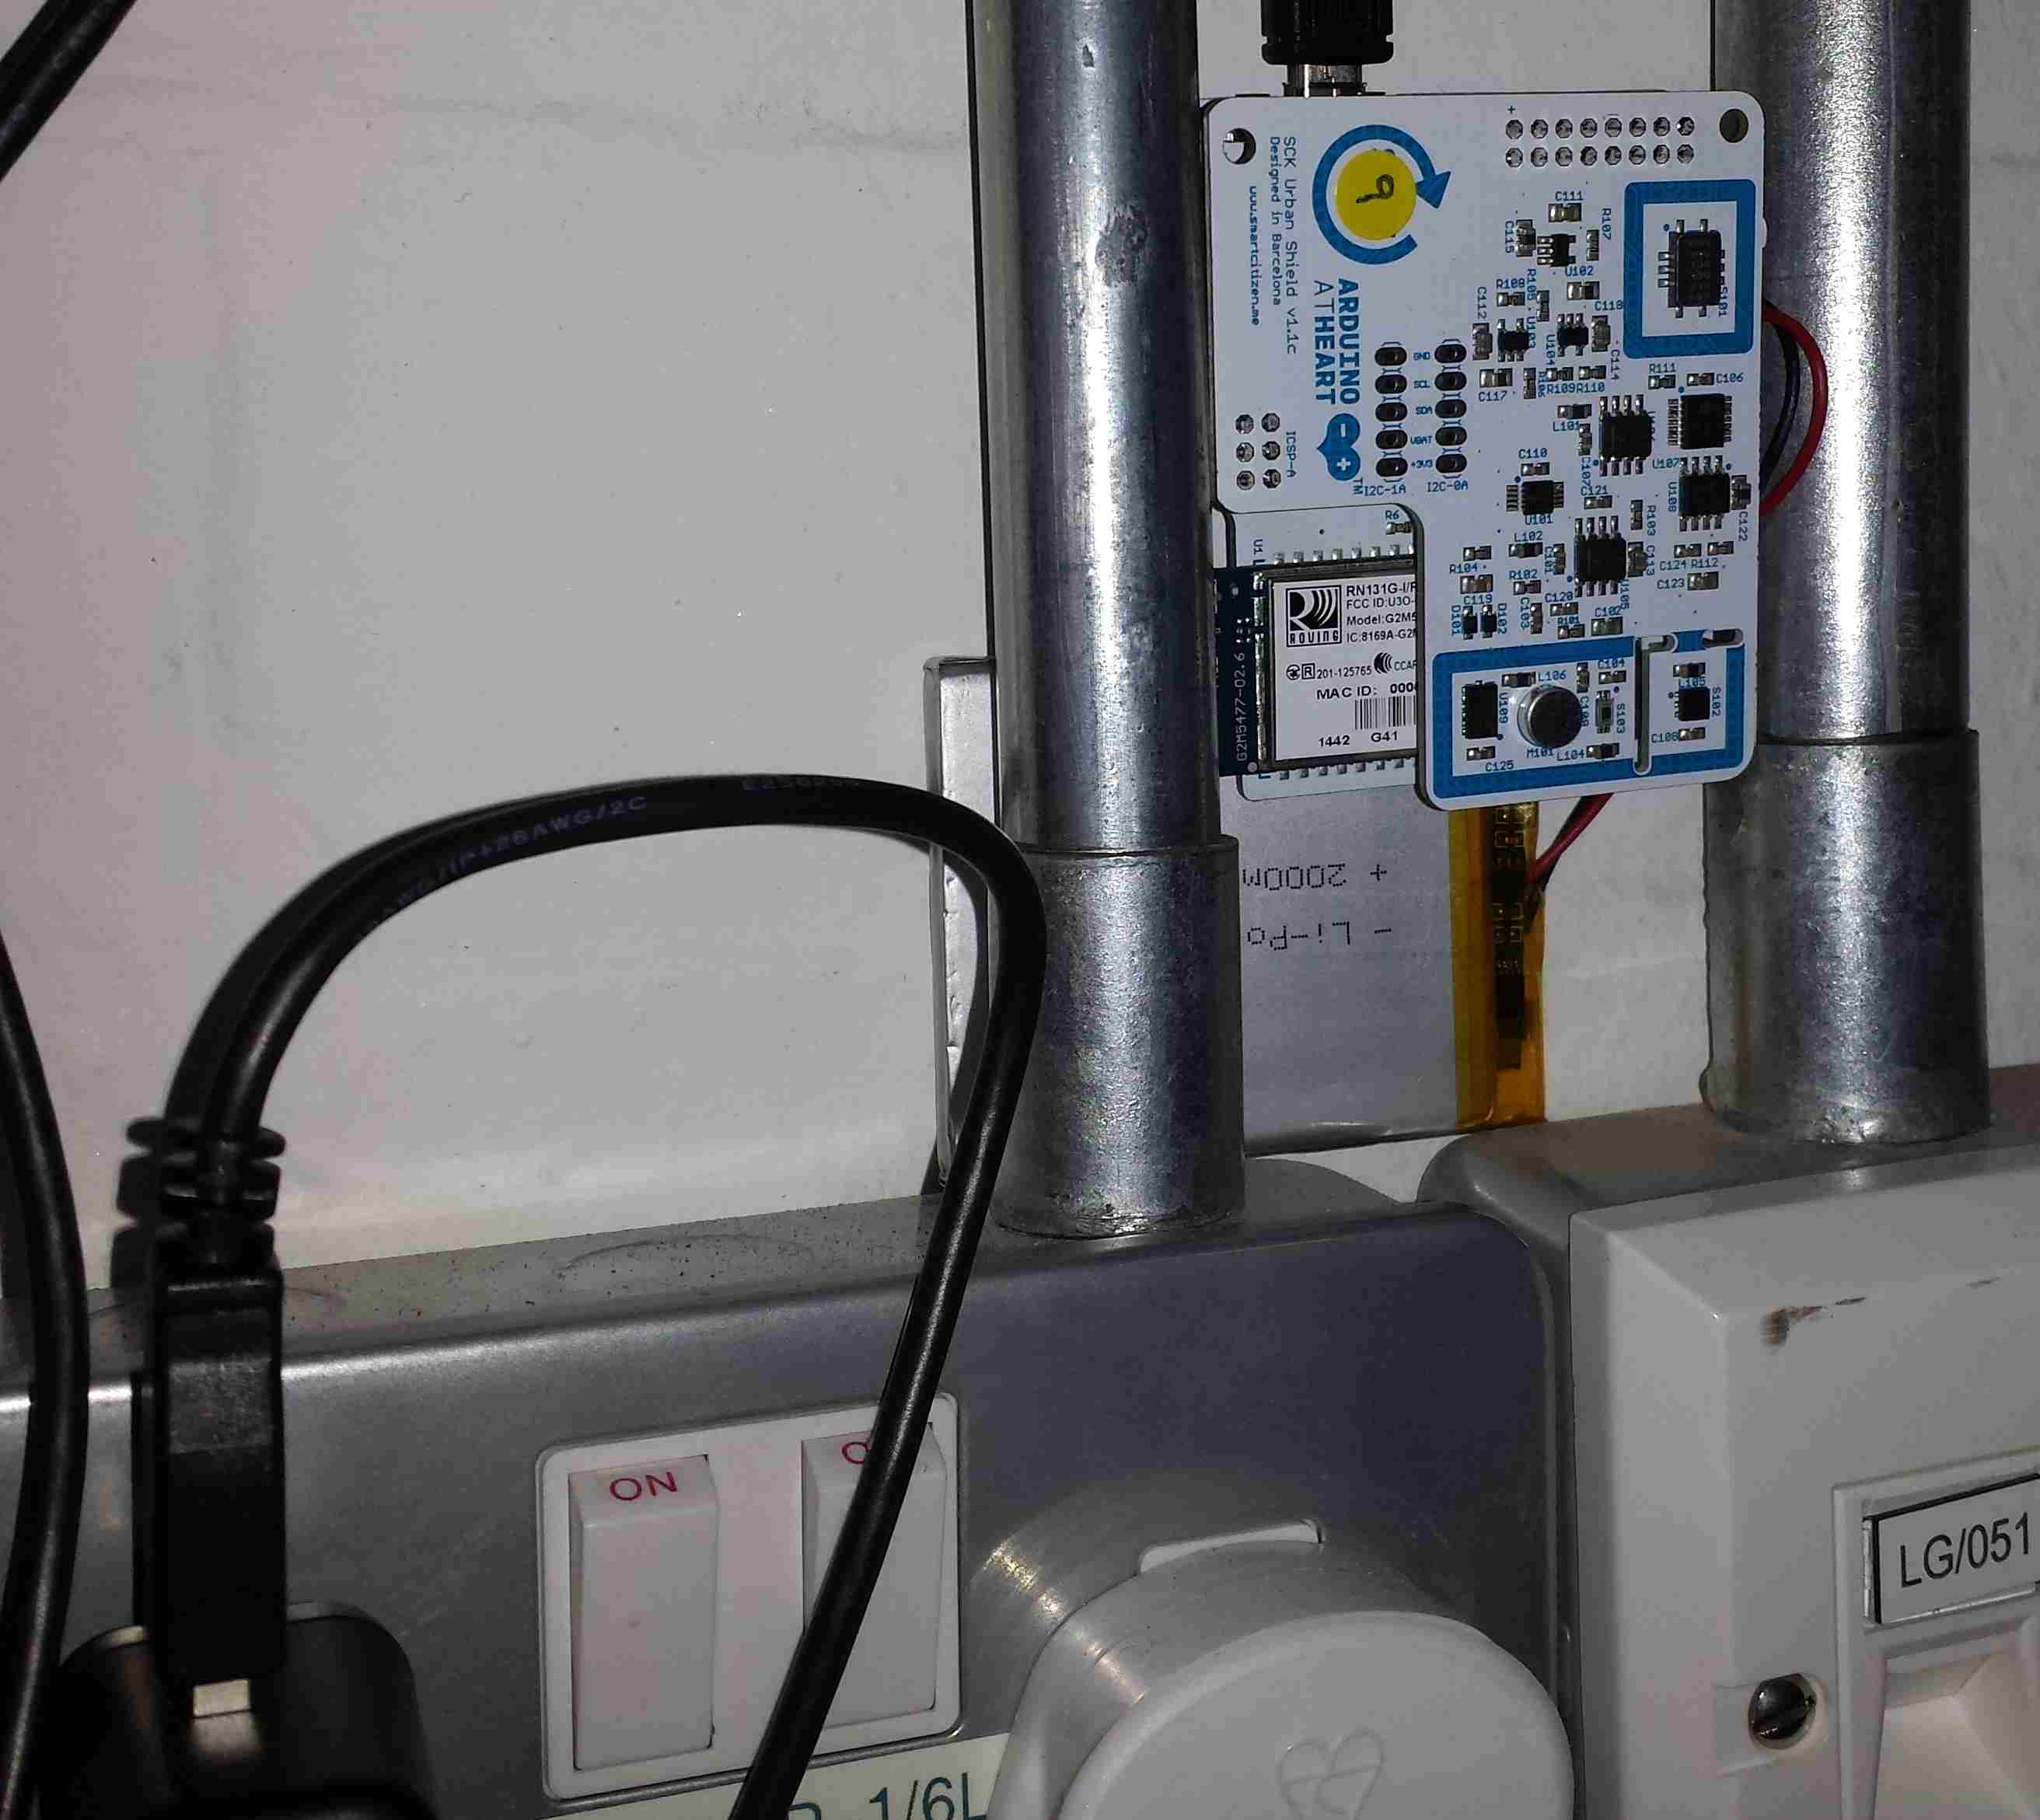
The picture below shows our 3-axis vibration sensor (plastic mounting/vibration interface laser cut by Elen from the FabLab, who do brown bag lunch and learn sessions if you are ever in central London). Two axis would probably been enough, and maybe even one, but we had the sensors and wanted to impress.
Recent Comments