Archive
Multiple estimates for the same project
The first question I ask, whenever somebody tells me that a project was delivered on schedule (or within budget), is which schedule (or budget)?
New schedules are produced for projects that are behind schedule, and costs get re-estimated.
What patterns of behavior might be expected to appear in a project’s reschedulings?
It is to be expected that as a project progresses, subsequent schedules become successively more accurate (in the sense of having a completion date and cost that is closer to the final values). The term cone of uncertainty is sometimes applied as a visual metaphor in project management, with the schedule becoming less uncertain as the project progresses.
The only publicly available software project rescheduling data, from Landmark Graphics, is for completed projects, i.e., cancelled projects are not included (121 completed projects and 882 estimates).
The traditional project management slide has some accuracy metric improving as work on a project approaches completion. The plot below shows the percentage of a project completed when each estimate is made, against the ratio  ; the y-axis uses a log scale so that under/over estimates appear symmetrical (code+data):
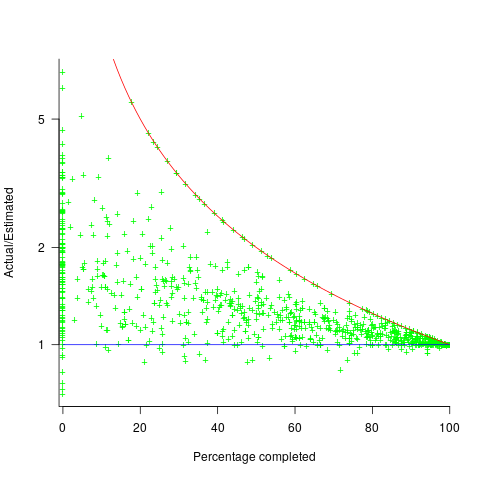
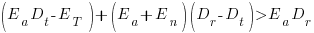
The closer a point to the blue line, the more accurate the estimate. The red line shows maximum underestimation, i.e., estimating that the project is complete when there is still more work to be done. A new estimate must be greater than (or equal) to the work already done, i.e.,  , and
, and  .
.
Rearranging, we get:  (plotted in red). The top of the ‘cone’ does not represent managements’ increasing certainty, with project progress, it represents the mathematical upper bound on the possible inaccuracy of an estimate.
In theory there is no limit on overestimating (i.e., points appearing below the blue line), but in practice management are under pressure to deliver as early as possible and to minimise costs. If management believe they have overestimated, they have an incentive to hang onto the time/money allocated (the future is uncertain).
Why does management invest time creating a new schedule?
If information about schedule slippage leaks out, project management looks bad, which creates an incentive to delay rescheduling for as long as possible (i.e., let’s pretend everything will turn out as planned). The Landmark Graphics data comes from an environment where management made weekly reports and estimates were updated whenever the core teams reached consensus (project average was eight times).
The longer a project is being worked on, the greater the opportunity for more unknowns to be discovered and the schedule to slip, i.e., longer projects are expected to acquire more re-estimates. The plot below shows the number of estimates made, for each project, against the initial estimated duration (red/green) and the actual duration (blue/purple); lines are loess fits (code+data):

What might be learned from any patterns appearing in this data?
When presented with data on the sequence of project estimates, my questions revolve around the reasons for spending time creating a new estimate, and the amount of time spent on the estimate.
A lot of time may have been invested in the original estimate, but how much time is invested in subsequent estimates? Are later estimates simply calculated as a percentage increase, a politically acceptable value (to the stakeholder funding for the project), or do they take into account what has been learned so far?
The information needed to answer these answers is not present in the data provided.
However, this evidence of the consistent provision of multiple project estimates drives another nail in to the coffin of estimation research based on project totals (e.g., if data on project estimates is provided, one estimate per project, were all estimates made during the same phase of the project?)
How to avoid being a victim of Brooks’ law
The oft cited book The Mythical Man Month contains a statement that has become known as Brooks’ Law: “Adding manpower to a late software project makes it later”.
When people join a project they need to learn project specific information, this is information that can only be obtained from people already working on the project. Training up new staff (e.g., developers, documentation writers) reduces the amount of effort being directly invested in building the system; it is an investment in people whose benefit is the post-training productivity of those people adding their effort to the project.
Let’s assume that a newbie diverts from the project they are joining an amount of effort units of time,  , in training without contributing anything, and that this training/investment lasts for
  units of time after which the trained person contributes an average of
  of effort per unit of time until the project deadline. This investment in a newbie will cause the project to be delayed unless the following inequality holds:
where  is the average daily project effort available before a newbie joins and
  is the number of units of time between the start of training and the delivery date/time.
This simplifies to:

an equation that makes the obvious point that as the deadline approaches the amount of time and effort spent training newbies needs to decrease if a worthwhile payback is to be achieved in the available time.
The quantity  is the amount of time remaining after the newbie finishes training (in practice this is rarely a well defined point in time, but let’s keep things simple) and is the only easily obtained information in the equation.
The effort contribution of the newbie, , could be approximated using information on the effort contribution of other people doing a similar job on the project. At least it could be if data was available on what their effort contribution was, and we overlooked the possible 5:1 difference in performance found between software developers. In practice a newbie’s effort contribution ramps up from zero, perhaps even starting during the training period, to a relatively constant long term daily average. How long does it take for to reach the long term average? I have no idea.
How much effort, , goes into training a newbie? A very important factor will obviously be their existing level of expertise with the application domain, tools being used, coding skills, etc (pretty much everything was new, back in the day, for the project analysed by Brooks, so was probably very high). There is also the somewhat nebulous but very important ability, or lack of, to pick things up quickly.
Could data on be obtained by recording every encounter the newbie has with existing project members? This would certainly enable information on first order time interactions to be obtained, but it would not tell us anything about the knock on effects caused by the work of an existing project member being delayed because they were investing in the newbie.
If many people are being added to a project at the same time it is easy to imagine it grinding to a halt because of all the minor congestion that occurs within the network of dependencies that project progress is waiting on.
I have not been able to locate any applicable data relating to training on software development projects, but then this area is at the edge of what I know about. Pointers to data most welcome.
Recent Comments