Archive
Does public disclosure of vulnerabilities improve vendor response?
Does public disclosure of vulnerabilities in vendor products result in them releasing a fix more quickly, compared to when the vulnerability is only disclosed to the vendor (i.e., no public disclosure)?
A study by Arora, Krishnan, Telang and Yang investigated this question and made their data available 🙂 So what does the data have to say (its from the US National Vulnerability Database over the period 2001-2003)?
The plot below is a survival curve for disclosed vulnerabilities, the longer it takes to release a patch to fix a vulnerability, the longer it survives.
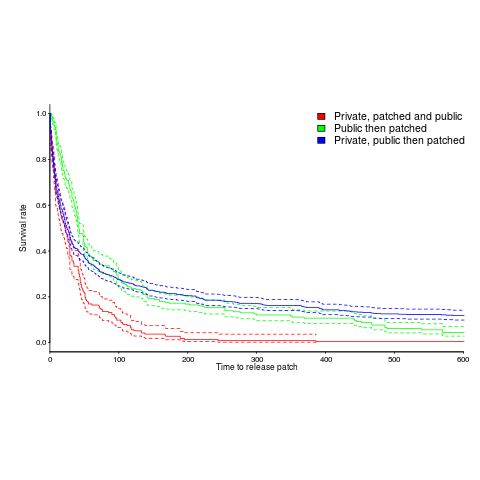
There is a popular belief that public disclosure puts pressure on vendors to release patchs more quickly, compared to when the public knows nothing about the problem. Yet, the survival curve above clearly shows publically disclosed vulnerabilities surviving longer than those only disclosed to the vendor. Is the popular belief wrong?
Digging around the data suggests a possible explanation for this pattern of behavior. Those vulnerabilities having the potential to cause severe nastiness tend not to be made public, but go down the path of private disclosure. Vendors prioritize those vulnerabilities most likely to cause the most trouble, leaving the less troublesome ones for another day.
This idea can be checked by building a regression model (assuming the necessary data is available and it is). In one way or another a lot of the data is censored (e.g., some reported vulnerabilities were not patched when the study finished); the Cox proportional hazards model can handle this (in fact, its the ‘standard’ technique to use for this kind of data).
This is a time dependent problem, some vulnerabilities start off being private and a public disclosure occurs before a patch is released, so there are some complications (see code+data for details). The first half of the output generated by R’s summary function, for the fitted model, is as follows:
Call:
coxph(formula = Surv(patch_days, !is_censored) ~ cluster(ID) +
    priv_di * (log(cvss_score) + y2003 + log(cvss_score):y2002) +
    opensource + y2003 + smallvendor + log(cvss_score):y2002,
    data = ISR_split)

  n= 2242, number of events= 2081

                                  coef exp(coef) se(coef) robust se       z Pr(>|z|)
priv_di                        1.64451   5.17849  0.19398   0.17798   9.240  < 2e-16 ***
log(cvss_score)                0.26966   1.30952  0.06735   0.07286   3.701 0.000215 ***
y2003                          1.03408   2.81253  0.07532   0.07889  13.108  < 2e-16 ***
opensource                     0.21613   1.24127  0.05615   0.05866   3.685 0.000229 ***
smallvendor                   -0.21334   0.80788  0.05449   0.05371  -3.972 7.12e-05 ***
log(cvss_score):y2002          0.31875   1.37541  0.03561   0.03975   8.019 1.11e-15 ***
priv_di:log(cvss_score)       -0.33790   0.71327  0.10545   0.09824  -3.439 0.000583 ***
priv_di:y2003                 -1.38276   0.25089  0.12842   0.11833 -11.686  < 2e-16 ***
priv_di:log(cvss_score):y2002 -0.39845 0.67136 0.05927 0.05272 -7.558 4.09e-14 *** |
The explanatory variable we are interested in is priv_di, which takes the value 1 when the vulnerability is privately disclosed and 0 for public disclosure. The model coefficient for this variable appears at the top of the table and is impressively large (which is consistent with popular belief), but at the bottom of the table there are interactions with other variable and the coefficients are less than 1 (not consistent with popular belief). We are going to have to do some untangling.
cvss_score is a score, assigned by NIST, for the severity of vulnerabilities (larger is more severe).
The following is the component of the fitted equation of interest:
*(0.34+0.4*y2002)-1.4*y2003)}")
where:  is 0/1,
 ") varies between 0.8 and 2.3 (mean value 1.8),
varies between 0.8 and 2.3 (mean value 1.8),  and
and  are 0/1 in their respective years.
Applying hand waving to average away the variables:
)} right e^{{priv~di}(1.6-0.6-(0.7/3+1.4/3))} right e^{{priv~di}*0.3}")
gives a (hand waving mean) percentage increase of *100 right 35%") , when
, when priv_di changes from zero to one. This model is saying that, on average, patches for vulnerabilities that are privately disclosed take 35% longer to appear than when publically disclosed
The percentage change of patch delivery time for vulnerabilities with a low cvvs_score is around 90% and for a high cvvs_score is around 13% (i.e., patch time of vulnerabilities assigned a low priority improves a lot when they are publically disclosed, but patch time for those assigned a high priority is slightly improved).
I have not calculated 95% confidence bounds, they would be a bit over the top for the hand waving in the final part of the analysis. Also the general quality of the model is very poor; Rsquare= 0.148 is reported. A better model may change these percentages.
Has the situation changed in the 15 years since the data used for this analysis? If somebody wants to piece the necessary data together from the National Vulnerability Database, the code is ready to go (ok, some of the model variables may need updating).
Update: Just pushed a model with Rsquare= 0.231, showing a 63% longer patch time for private disclosure.
Recent Comments