Archive
Practical statistics books for software engineers
So you have read my (draft) book on evidence-based software engineering and want to learn more about the statistical techniques used, but are not interested lots of detailed mathematics. What books do I suggest?
All the following books are sitting on the shelf next to where I write (not that they get read that much these days).
Before I took the training wheels off my R usage, my general go to book was (I still look at it from time to time): “The R Book” by Crawley, second edition; “R in Action” by Kabacoff is a good general read.
In alphabetical subject order:
Categorical data: “Categorical Data Analysis” by Agresti, the third edition is a weighty tomb (in content and heaviness). Plenty of maths+example; more of a reference.
Compositional data: “Analyzing compositional data with R” by van den Boogaart and Tolosana-Delgado, is more or less the only book of its kind. Thankfully, it is quite good.
Count data: “Modeling count data” by Hilbe, may be more than you want to know about count data. Readable.
Circular data: “Circular statistics in R” by Pewsey, Neuhauser and Ruxton, is the only non-pure theory book available. The material seems to be there, but is brief.
Experiments: “Design and analysis of experiments” by Montgomery.
General: “Applied linear statistical models” by Kutner, Nachtsheim, Neter and Li, covers a wide range of topics (including experiments) using a basic level of mathematics.
Machine learning: “An Introduction to Statistical Learning: with Applications in R” by James, Witten, Hastie and Tibshirani, is more practical (but not dumbed down, like some) and less maths (a common problem with machine learning books, e.g., “The Elements of Statistical Learning”). Watch out for the snake-oil salesmen using machine learning.
Mixed-effects models: “Mixed-effects models in S and S-plus” by Pinheiro and Bates, is probably the book I prefer; “Mixed effects models and extensions in ecology with R” by Zuur, Ieno, Walker, Saveliev and Smith, is another view on an involved topic (plus lots of ecological examples).
Modeling: “Statistical rethinking” by McElreath, is full of interesting modeling ideas, using R and Stan. I wish I had some data to try out some of these ideas.
Regression analysis: “Applied Regression Analysis and Generalized Linear Models” by Fox, now in its third edition (I also have the second edition). I found this the most useful book, of those available, for a more detailed discussion of regression analysis. Some people like “Regression modeling strategies” by Harrell, but this does not appeal to me.
Survival analysis: “Introducing survival and event history analysis” by Mills, is a readable introduction covering everything; “Survival analysis” by Kleinbaum and Klein, is full of insights but more of a book to dip into.
Time series: The two ok books are: “Time series analysis and its application: with R examples” by Shumway and Stoffler, contains more theory, while “Time series analysis: with applications in R” by Cryer and Chan, contains more R code.
There are lots of other R/statistics books on my shelves (just found out I have 31 of Springer’s R books), some ok, some not so. I have a few ‘programming in R’ style books; if you are a software developer, R the language is trivial to learn (its library is another matter).
Suggestions for books covering topics I have missed welcome, or your own preferences (as a software developer).
StatsModels: the first nail in R’s coffin
In 2012, when I decided to write a book on evidence-based software engineering, R was the obvious system to use for data analysis. At the time, lots of new books had “using R” or “with R” added at the end of their titles; I chose “using R”.
When developers tell me they need to do some statistical analysis, and ask whether they should use Python or R, I tell them to use Python if statistics is a small part of the program, otherwise use R.
If I started work on the book today, I would till choose R. If I were starting five-years from now, I could be choosing Python.
To understand why I think Python will eventually take over the niche currently occupied by R, we need to understand the unique selling points of both systems.
R’s strengths are that it supports a way of thinking that is a good fit for doing data analysis and has an extensive collection of packages that simplify the task of applying a wide variety of analysis techniques to data.
Python also has packages supporting the commonly used data analysis techniques. But nearly all the Python packages provide a developer-mentality interface (i.e., they provide an API like any other package), R provides data-analysis-mentality interfaces. R supports a way of thinking that data analysts can identify with.
Python’s strengths, over R, are a much larger base of developers and language support for writing large programs (R is really a scripting language). Yes, Python has a package ecosystem supporting the full spectrum of application domains, this is not relevant for analysing a successful invasion of R’s niche market (but it is relevant for enticing new developers who are still making up their mind).
StatsModels is a Python package based around R’s data-analysis-mentality interface. When I discovered this package a few months ago, I realised the first nail had been hammered into R’s coffin.
Yes, today R has nearly all the best statistical analysis packages and a large chunk of the leading edge stuff. But packages can be reimplemented (C code can be copy-pasted, the R code mapped to Python); there is no magic involved. Leading edge has a short shelf life, and what proves to be useful can be duplicated; the market for leading edge code in a mature market (e.g., data analysis) is tiny.
A bunch of bright young academics looking to make a name for themselves will see the major trees in the R forest have been felled. The trees in the Python data-analysis-mentality forest are still standing; all it takes is a few people wanting to be known as the person who implemented the Python package that everybody uses for XYZ analysis.
A collection of packages supporting the commonly (and eventually not so commonly) used data analysis techniques, with a data-analysis-mentality interface, removes a major selling point for using R. Python is a bigger developer market with support for many other application domains.
The flow of developers starting out with R will slow down, casual R users will have nothing to lose from trying out another language when the right project comes along (another language on the CV looks good and Python is a bigger market). There will be groups where everybody uses R and will continue to use R because that is what everybody else in the group uses. Ten-Twenty years from now R, developers could be working in a ghost town.
Source code chapter added to “Evidence-based software engineering using R”
The Source Code chapter of my evidence-based software engineering book has been added to the draft pdf (download here).
This chapter has suffered from coming last and there is still lots of work to be done. Almost all the source code related data has been plundered to fill up earlier chapters. Some data did not make the cut-off for release of the draft; a global review will probably result in some data migrating back to this chapter.
When talking to developers about the book I am constantly being asked ‘what is empirical software engineering?’ My explanation uses the phrase ‘evidence-based’, which everybody seems to immediately understand. It is counterproductive having a title that has to be explained, so I have changed the title to “Evidence-based Software Engineering using R”.
What is the purpose of a chapter discussing source code in a book on evidence-based software engineering? Source code is obviously an essential component of the topics discussed in the other chapters, but what is so particular to source code that it could not be said elsewhere? Having spent most of my professional life studying source code, first as a compiler writer and then involved with static analysis, am I just being driven by an attachment to the subject?
My view of source code is very different from most other developers: when developers talk about code, they spend most of the time talking about how they do things, when I talk about code I spend most of the time talking about how other developers do things (I’m a mongrel writer of code). Developers’ blinkered view of code prevents them seeing bigger pictures. I take a Gricean view of code and refrain from using meaningless marketing terms such as maintainability, readability and testability.
I have lots of source code data of interest to compiler writers (who are not the target audience) and I have lots of data related to static analysis (tool developers are not the audience). The target audience is professional software developers and hopefully what has been written is of interest to that readership.
I have been promised all sorts of data. Hopefully some of it will arrive. If somebody tells you they promised to send me data, please encourage them to take some time to sort out the data and send it.
As always, if you know of any interesting software engineering data, please tell me.
Finalizing the statistical analysis material in the second half of the book (released almost two years ago) next.
Reliability chapter added to “Empirical software engineering using R”
The Reliability chapter of my Empirical software engineering book has been added to the draft pdf (download here).
I have been working on this draft for four months and it still needs lots of work; time to move on and let it stew for a while. Part of the problem is lack of public data; cost and schedule overruns can be rather public (projects chapter), but reliability problems are easier to keep quiet.
Originally there was a chapter covering reliability and another one covering faults. As time passed, these merged into one. The material kept evaporating in front of my eyes (around a third of the initial draft, collected over the years, was deleted); I have already written about why most fault prediction research is a waste of time. If it had not been for Rome I would not have had much to write about.
Perhaps what will jump out at people most, is that I distinguish between mistakes in code and what I call a fault experience. A fault_experience=mistake_in_code + particular_input. Most fault researchers have been completely ignoring half of what goes into every fault experience, the input profile (if the user does not notice a fault, I do not consider it experienced) . It’s incredibly difficult to figure out anything about the input profile, so it has been quietly ignored (one of the reasons why research papers on reported faults are such a waste of time).
I’m also missing an ‘interesting’ figure on the opening page of the chapter. Suggestions welcome.
I have not said much about source code characteristics. There is a chapter covering source code, perhaps some of this material will migrate to reliability.
All sorts of interesting bits and pieces have been added to earlier chapters. Ecosystems keeps growing and in years to come somebody will write a multi-volume tomb on software ecosystems.
I have been promised all sorts of data. Hopefully some of it will arrive.
As always, if you know of any interesting software engineering data, please tell me.
Source code chapter next.
Data-set update to “Empirical software engineering using R”
The pile of papers, books and data-sets, relating to previously released draft chapters of my Empirical software engineering book, has been growing, and cluttering up my mind. I decided to have a clear-out.
A couple of things stood out.
There are around 25 data-sets that have been promised but not yet arrived. If you encounter anybody who mentions they promised to send me data, please encourage them to spend some time doing this. I don’t want to add a new category, promised but never delivered, to the list of email responses.
There has been an increase in data-sets not being used because I already have something better. This is a good sign, data quality is increasing. One consequence is that a growing number of ‘historical’ data-sets have fallen by the wayside. This is a good thing, most data-sets analysed in papers are very low quality and only used because nothing else was available.
One of my reasons for making draft releases was to prompt people to suggest data I had missed. This has not happened yet; come on people, suggest some data I don’t yet know about.
About a third of the pile got included in the latest draft, a third had been superseded by something better, and a third are still waiting for promised data.
Now, back to the reliability chapter.
Projects chapter added to “Empirical software engineering using R”
The Projects chapter of my Empirical software engineering book has been added to the draft pdf (download here).
This material turned out to be harder to bring together than I had expected.
Building software projects is a bit like making sausages in that you don’t want to know the details, or in this case those involved are not overly keen to reveal the data.
There are lots of papers on requirements, but remarkably little data (Soo Ling Lim’s work being the main exception).
There are lots of papers on effort prediction, but they tend to rehash the same data and the quality of research is poor (i.e., tweaking equations to get a better fit; no explanation of why the tweaks might have any connection to reality). I had not realised that Norden did all the heavy lifting on what is sometimes called the Putnam model; Putnam was essentially an evangelist. The Parr curve is a better model (sorry, no pdf), but lacked an evangelist.
Accurate estimates are unrealistic: lots of variation between different people and development groups, the client keeps changing the requirements and developer turnover is high.
I did turn up a few interesting data-sets and Rome came to the rescue in places.
I have been promised more data and am optimistic some will arrive.
As always, if you know of any interesting software engineering data, please tell me.
I’m looking to rerun the workshop on analyzing software engineering data. If anybody has a venue in central London, that holds 30 or so people+projector, and is willing to make it available at no charge for a series of free workshops over several Saturdays, please get in touch.
Reliability chapter next.
Ecosystems chapter added to “Empirical software engineering using R”
The Ecosystems chapter of my Empirical software engineering book has been added to the draft pdf (download here).
I don’t seem to be able to get away from rewriting everything, despite working on the software engineering material for many years. Fortunately the sparsity of the data keeps me in check, but I keep finding new and interesting data (not a lot, but enough to slow me down).
There is still a lot of work to be done on the ecosystems chapter, not least integrating all the data I have been promised. The basic threads are there, they just need filling out (assuming the promised data sets arrive).
I did not get any time to integrate in the developer and economics data received since those draft chapters were released; there has been some minor reorganization.
As always, if you know of any interesting software engineering data, please tell me.
I’m looking to rerun the workshop on analyzing software engineering data. If anybody has a venue in central London, that holds 30 or so people+projector, and is willing to make it available at no charge for a series of free workshops over several Saturdays, please get in touch.
Projects chapter next.
Warp your data to make it visually appealing
Data plots can sometimes look very dull and need to be jazzed up a bit. Now, nobody’s suggesting that the important statistical properties of the data be changed, but wouldn’t it be useful if the points could be moved around a bit, to create something visually appealing without losing the desired statistical properties?
Readers have to agree that the plot below looks like fun. Don’t you wish your data could be made to look like this?

Well, now you can (code here, inspired by Matejka and Fitzmaurice who have not released their code yet). It is also possible to thin-out the points, while maintaining the visual form of the original image.
The idea is to perturb the x/y position of very point by a small amount, such that the desired statistical properties are maintained to some level of accuracy:
check_prop=function(new_pts, is_x)
{
if (is_x)
   return(abs(myx_mean-stat_cond(new_pts)) < 0.01)
else
   return(abs(myy_mean-stat_cond(new_pts)) < 0.01)
}


mv_pts=function(pts)
{
repeat
   {
   new_x=pts$x+runif(num_pts, -0.01, 0.01)
   if (check_prop(new_x, TRUE))
      break()
   }

repeat
   {
   new_y=pts$y+runif(num_pts, -0.01, 0.01)
   if (check_prop(new_y, FALSE))
      break()
   }

return(data.frame(x=new_x, y=new_y))
} |
The distance between the perturbed points and the positions of the target points then needs to be calculated. For each perturbed point its nearest neighbor in the target needs to be found and the distance calculated. This can be done in  using kd-trees and of course there is an R package, RANN, do to this (implemented in the
 nn2 function). The following code tries to minimize the sum of the distances, another approach is to minimize the mean distance:
mv_closer=function(pts)
{
repeat
   {
   new_pts=mv_pts(pts)
   new_dist=nn2(rabbit, new_pts, k=1)
   if (sum(new_dist$nn.dists) < cur_dist)
      {
      cur_dist <<- sum(new_dist$nn.dists)
      return(new_pts)
      }
   }

} |
Now it’s just a matter of iterating lots of times, existing if the distance falls below some limit:
iter_closer=function(tgt_pts, src_pts)
{
cur_dist <<- sum(nn2(tgt_pts, src_pts, k=1)$nn.dists)
cur_pts=src_pts
for (i in 1:5000)
   {
   new_pts=mv_closer(cur_pts)
   cur_pts=new_pts
   if (cur_dist < 13)
      return(cur_pts)
   }
return(cur_pts)
} |
This code handles a single statistical property. Matejka and Fitzmaurice spent more than an hour on their implementation, handle multiple properties and use simulated annealing to prevent being trapped in local minima.
An example, with original points in yellow:
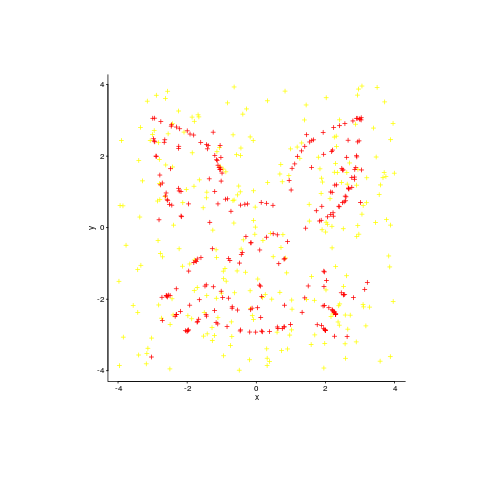
Enjoy.
Economics chapter added to “Empirical software engineering using R”
The Economics chapter of my Empirical software engineering book has been added to the draft pdf (download here).
This is a slim chapter, it might grow a bit, but I suspect not by a huge amount. Reasons include lots of interesting data being confidential and me not having spent a lot of time on this topic over the years (so my stash of accumulated data is tiny). Also, a significant chunk of the economics data I have is used to discuss issues in the Ecosystems and Projects chapters, perhaps some of this material will migrate back once these chapters are finalized.
You might argue that Economics is more important than Human cognitive characteristics and should have appeared before it (in chapter order). I would argue that hedonism by those involved in producing software is the important factor that pushes (financial) economics into second place (still waiting for data to argue my case in print).
Some of the cognitive characteristics data I have been waiting for arrived, and has been added to this chapter (some still to be added).
As always, if you know of any interesting software engineering data, please tell me.
I am after a front cover. A woodcut of alchemists concocting a potion appeals, perhaps with various software references discretely included, or astronomy related (the obvious candidate has already been used). The related modern stuff I have seen does not appeal. Suggestions welcome.
Ecosystems next.
Empirical Software Engineering using R: first draft available for download
A draft of my book Empirical Software Engineering using R is now available for download.
The book essentially comes in two parts:
- statistical techniques that are useful for analyzing software engineering data. This draft release contains most of the techniques I plan to cover. I am interested in hearing about any techniques you think ought to be covered, but I only cover techniques when real data is available to use in an example,
- six chapters covering what I consider to be the primary aspects of software engineering. This draft release includes the Human Cognitive Characteristics chapter and I am hoping to release one each of the remaining chapters every few months (Economics is next).
There is a page for making suggestions and problem reports.
All the code+data is available and I am claiming to have a copy of all the important, publicly available, software engineering data. If you know of any I don’t have, please let me know.
I am looking for a publisher. The only publisher I have had serious discussions with decided not to go ahead because of my insistence of releasing a free copy of the pdf. Self-publishing is a last resort.
Recent Comments