Archive
The aura of software quality
Bad money drives out good money, is a financial adage. The corresponding research adage might be “research hyperbole incentivizes more hyperbole”.
Software quality appears to be the most commonly studied problem in software engineering. The reason for this is that use of the term software quality imbues what is said with an aura of relevance; all that is needed is a willingness to assert that some measured attribute is a metric for software quality.
Using the term “software quality” to appear relevant is not limited to researchers; consultants, tool vendors and marketers are equally willing to attach “software quality” to whatever they are selling.
When reading a research paper, I usually hit the delete button as soon as the authors start talking about software quality. I get very irritated when what looks like an interesting paper starts spewing “software quality” nonsense.
The paper: A Family of Experiments on Test-Driven Development commits the ‘crime’ of framing what looks like an interesting experiment in terms of software quality. Because it looked interesting, and the data was available, I endured 12 pages of software quality marketing nonsense to find out how the authors had defined this term (the percentage of tests passed), and get to the point where I could start learning about the experiments.
While the experiments were interesting, a multi-site effort and just the kind of thing others should be doing, the results were hardly earth-shattering (the experimental setup was dictated by the practicalities of obtaining the data). I understand why the authors felt the need for some hyperbole (but 12-pages). I hope they continue with this work (with less hyperbole).
Anybody skimming the software engineering research literature will be dazed by the number and range of factors appearing to play a major role in software quality. Once they realize that “software quality” is actually a meaningless marketing term, they are back to knowing nothing. Every paper has to be read to figure out what definition is being used for “software quality”; reading a paper’s abstract does not provide the needed information. This is a nightmare for anybody seeking some understanding of what is known about software engineering.
When writing my evidence-based software engineering book I was very careful to stay away from the term “software quality” (one paper on perceptions of software product quality is discussed, and there are around 35 occurrences of the word “quality”).
People in industry are very interested in software quality, and sometimes they have the confusing experience of talking to me about it. My first response, on being asked about software quality, is to ask what the questioner means by software quality. After letting them fumble around for 10 seconds or so, trying to articulate an answer, I offer several possibilities (which they are often not happy with). Then I explain how “software quality” is a meaningless marketing term. This leaves them confused and unhappy. People have a yearning for software quality which makes them easy prey for the snake-oil salesmen.
Quality control in a zero cost of replication business
When a new manufacturing material becomes available, its use is often integrated with existing techniques, e.g., using scientific management techniques for software production.
Customers want reliable products, and companies that sell unreliable products don’t make money (and may even lose lots of money).
Quality assurance of manufactured products is a huge subject, and lots of techniques have been developed.
Needless to say, quality assurance techniques applied to the production of hardware are often touted (and sometimes applied) as the solution for improving the quality of software products (whatever quality is currently being defined as).
There is a fundamental difference between the production of hardware and software:
- Hardware is designed, a prototype made and this prototype refined until it is ready to go into production. Hardware production involves duplicating an existing product. The purpose of quality control for hardware production is ensuring that the created copies are close enough to identical to the original that they can be profitably sold. Industrial design has to take into account the practicalities of mass production, e.g., can this device be made at a low enough cost.
- Software involves the same design, prototype, refinement steps, in some form or another. However, the final product can be perfectly replicated at almost zero cost, e.g., downloadable file(s), burn a DVD, etc.
Software production is a once-off process, and applying techniques designed to ensure the consistency of a repetitive process don’t sound like a good idea. Software production is not at all like mass production (the build process comes closest to this form of production).
Sometimes people claim that software development does involve repetition, in that a tiny percentage of the possible source code constructs are used most of the time. The same is also true of human communications, in that a few words are used most of the time. Does the frequent use of a small number of words make speaking/writing a repetitive process in the way that manufacturing identical widgets is repetitive?
The virtually zero cost of replication (and distribution, via the internet, for many companies) does more than remove a major phase of the traditional manufacturing process. Zero cost of replication has a huge impact on the economics of quality control (assuming high quality is considered to be equivalent to high reliability, as measured by number of faults experienced by customers). In many markets it is commercially viable to ship software products that are believed to contain many mistakes, because the cost of fixing them is so very low; unlike the cost of hardware, which is non-trivial and involves shipping costs (if only for a replacement).
Zero defects is not an economically viable mantra for many software companies. When companies employ people to build the same set of items, day in day out, there is economic sense in having them meet together (e.g., quality circles) to discuss saving the company money, by reducing production defects.
Many software products have a short lifespan, source code has a brief and lonely existence, and many development projects are never shipped to paying customers.
In software development companies it makes economic sense for quality circles to discuss the minimum number of known problems they need to fix, before shipping a product.
A prisoner’s dilemma when agreeing to a management schedule
Two software developers, both looking for promotion/pay-rise by gaining favorable management reviews, are regularly given projects to complete by a date specified by management; the project schedules are sometimes unachievable, with probability  .
.
Let’s assume that both developers are simultaneously given a project, and the corresponding schedule. If the specified schedule is unachievable, High quality work can only be performed by asking for more time, otherwise performing Low quality work is the only way of meeting the schedule.
If either developer faces an unachievable deadline, they have to immediately decide whether to produce High or Low quality work. A High quality decision requires that they ask management for more time, and incur a penalty they perceive to be  (saying they cannot meet the specified schedule makes them feel less worthy of a promotion/pay-rise); a Low quality decision is perceived to be likely to incur a penalty of
  (because of its possible downstream impact on project completion), if one developer chooses Low, and
  , if both developers choose Low. It is assumed that:
  .
.
This is a prisoner’s dilemma problem. The following mathematical results are taken from: The Effects of Time Pressure on Quality in Software Development: An Agency Model, by Robert D. Austin (cannot find a downloadable pdf).
There are two Nash equilibriums, for the decision made by the two developers: Low-Low and High-High (i.e., both perform Low quality work, or both perform High quality work). Low-High is not a stable equilibrium, in that on the next iteration the two developers may switch their decisions.
High-High is a pure strategy (i.e., always use it), when: 
High-High is Pareto superior to Low-Low when: 
How might management use this analysis to increase the likelihood that a High-High quality decision is made?
Evidence shows that 50% of developer estimates, of task effort, underestimate the actual effort; there is sufficient uncertainty in software development that the likelihood of consistently produce accurate estimates is low (i.e., is a very fuzzy quantity). Managers wanting to increase the likelihood of a High-High decision could be generous when setting deadlines (e.g., multiple developer estimates by 200%, when setting the deadline for delivery), but managers are often under pressure from customers, to specify aggressively short deadlines.
The penalty for a developer admitting that they cannot deliver by the specified schedule, , could be set very low (e.g., by management not taking this factor into account when deciding developer promotion/pay-rise). But this might encourage developers to always give this response. If all developers mutually agreed to cooperate, to always give this response, none of them would lose relative to the others; but there is an incentive for the more capable developers to defect, and the less capable developers to want to use this strategy.
Regular code reviews are a possible technique for motivating High-High, by increasing the likelihood of any lone Low decision being detected. A Low-Low decision may go unreported by those involved.
To summarise: an interesting analysis that appears to have no practical use, because reasonable estimates of the values of the variables involved are unavailable.
Finding the gold nugget papers in software engineering research
Academic research projects are like startups in that most fail to make any return on their investment (e.g., the tax payer does not get any money back) and a few pay for themselves and all the failures. Irrespective of whether a project succeeds or fails, those involved will publish papers on the work, give talks at conferences and workshops and general try to convince anyone who will listen that the project was a great success.
Number or papers published plays an important role in evaluating the quality of a university department and the performance on an individual researcher. As you can imagine, this publish or perish culture leads to huge amounts of clueless nonsense ending up in print. Don’t be fooled by the ‘peer reviewed’ label, most of this gets done by the least experienced people (e.g., postgrad students) as a means of gaining social recognition in their specific research community, i.e., those doing the reviewing don’t always know much.
The huge number of papers describing failed projects and/or containing clueless nonsense is a major obstacle for anyone wanting to locate useful new knowledge.
While writing my C book I refined the following approach to finding high quality papers and created filtering rules for the subjects it covered. The rules below are being applied to papers relating to my Empirical Software Engineering book. I don’t claim any usefulness for these rules outside of academic software engineering research.
I use a scatter gun approach to obtain a basic collection of papers followed by ruthless filtering.
The scatter gun approach might start with one or two papers; following links on Google Scholar or even just Google search results filtered on “filetype:pdf”, in the past I have used CiteSeer which Google now does a better job of indexing, and Semantic Scholar is now starting to be quite good.
After 30 minutes or so I have 50 pdfs (I download maybe 4,000 a year). Now I need to quickly filter the nonsense to end up with maybe 10 that I will spend 5 minutes each reading, leaving maybe 2 or 3 for detailed reading (often not the original ones I started with).
When dealing with this kind of volume you have to be ruthless.
Spend just 10 seconds on the first pass. If a paper has some merits, let it remain for the next pass. Scan the paper looking for major indicators of clueless nonsense; these are not hard to spot, don’t linger, hit the delete (if data is involved, it is worth quickly checking the footnotes for a url to a dataset, which may be new and worth collecting):
- it relies on machine learning,
- it relies on information theory,
- it relies on Halstead’s metric,
- it investigates software quality. This is a marketing term used to give a patina of relevance to the worthless metric that is likely used in the research. Be on the lookout for other high relevance terms being used to provide a positive association with a worthless metric, e.g., developer productivity defined as volume of code written
- it involves fault prediction. Academic folk psychology includes a belief that some project files contain more faults than other files, because more faults are reported in some files than others (or even that entire projects are more reliable because fewer faults have been reported). This is a case of the drunk searching under a streetlight for lost keys because that is where the ground can be seen. Faults are found by executing code, more execution means more faults. I only know of two papers that are exceptions to this rule (one of them is discussed here),
- the primary claim in the conclusion is to have done something novel. Research requires doing new stuff, novel is a key attribute that is rather pointless for its own sake. Typing code using your nose would be novel, but would you want to spend more than 10 seconds reading a paper on the subject (and this example is at the more sensible end of the spectrum of novel research I have read about).
The first pass removes around 70-80% of the papers, at least for me.
For the second pass I will spend a minute or so doing a slightly slower scan. This often cuts the papers remaining in half.
By now, I have been collecting and filtering for over 90 minutes; time to do something else, perhaps not returning for many hours.
The third pass involves trying to read the paper. The question is: Am I having trouble reading this paper because the author has managed to compress a lot of useful information into a publication page limit, or is the paper so bad I cannot see the wood for the dead trees?
Answering this question takes practice and some knowledge of the subject area. You will speed up with practice and learning about the subject.
Some things that might be thought worth paying attention to, but should be ignored:
- don’t bother looking at the names of the authors or which university they work at (who wrote the paper almost always provides no clues to its quality; there are very few exceptions to this and you will learn who they are over time),
- ignore the journal or conference that published the paper (gold nuggets appear everywhere and high impact venues only restrict the clueless nonsense to the current trendy topics and papers citing the ‘right’ people),
- ignore year of publication, quality is ageless (and sometimes fades from view because research fashions change).
If you have your own tips for finding the gold nuggets in software engineering, please let me know.
Compiler benchmarking for the 21st century
I would like to propose a new way of measuring the quality of a compiler’s code generator: The highest quality compiler is one that generates identical code for all programs that produce the same output, e.g., a compiler might spot programs that calculate pi and always generate code that uses the most rapidly converging method known. This is a very different approach to the traditional methods based on using (mostly) execution time or size (usually code but sometimes data) as a measure of quality.
Why is a new measurement method needed, and why choose this one? It is relatively easy for compiler vendors to tune their products to the commonly used benchmark and they seem to have lost their role as drivers for new optimization techniques. Different developers have different writing habits and companies should not have to waste time and money changing developer habits just to get the best quality code out of a compiler; compilers should handle differences in developer coding habits and not let it affect the quality of generated code. There are major savings to be had by optimizing the effect that developers are trying to achieve rather than what they have actually written (these days new optimizations targeting at what developers have written show very low percentage improvements).
Deducing that a function calculates pi requires a level of sophistication in whole program analysis that is unlikely to be available in production compilers for some years to come (ok, detecting 4*atan(1.0) is possible today). What is needed is a collection of compilable files containing source code that aims to achieve an outcome in lots of different ways. To get the ball rolling the “3n times 2” problem is presented as the first of this new breed of benchmarks.
The “3n times 2” problem is a variant on the 3n+1 problem that has been tweaked to create more optimization opportunities. One implementation of the “3n times 2” problem is:
if (is_odd(n)) n = 3*n+1; else n = 2*n; // this is n = n / 2; in the 3n+1 problem |
There are lots of ways of writing code that has the same effect, some of the statements I have seen for calculating n=3*n+1 include: n = n + n + n + 1, n = (n << 1) + n + 1 and n *= 3; n++, while some of the ways of checking if n is odd include: n & 1, (n / 2)*2 != n and n % 2.
I have created a list of different ways in which 3*n+1 might be calculated and is_odd(n) might be tested and written a script to generate a function containing all possible permutations (to reduce the number of combinations no variants were created for the least interesting case of n=2*n, which was always generated in this form). The following is a snippet of the generated code (download everything):
if (n & 1) n=(n << 2) - n +1; else n*=2; if (n & 1) n=3*n+1; else n*=2; if (n & 1) n += 2*n +1; else n*=2; if ((n / 2)*2 != n) { t=(n << 1); n=t+n+1; } else n*=2; if ((n / 2)*2 != n) { n*=3; n++; } else n*=2; |
Benchmarks need a means of summarizing the results and here I make a stab at doing that for gcc 4.6.1 and llvm 2.9, when executed using the -O3 option (output here and here). Both compilers generated a total of four different sequences for the 27 'different' statements (I'm not sure what to do about the inline function tests and have ignored them here) with none of the sequences being shared between compilers. The following lists the number of occurrences of each sequence, e.g., gcc generated one sequence 16 times, another 8 times and so on:
gcc    16   8   2   1
llvm   12   6   6   3
How might we turn these counts into a single number that enables compiler performance to be compared? One possibility is to award 1 point for each of the most common sequence, 1/2 point for each of the second most common, 1/4 for the third and so on. Using this scheme, gcc gets 20.625, and llvm gets 16.875. So gcc has greater consistency (I am loathed to use the much overused phrase higher quality).
Now for a closer look at the code generated.
Both compilers always generated code to test the least significant bit for the conditional expressions n & 1 and n % 2. For the test (n / 2)*2 != n gcc generated the not very clever right-shift/left-shift/compare while llvm and'ed out the bottom bit and then compared; so both compilers failed to handle what is a surprisingly common check for a number being odd.
The optimal code for n=3*n+1 on a modern x86 processor is (lots of register combinations are possible, let's assume rdx contains n) leal 1(%rdx,%rdx,2), %edx and this is what both compilers generated a lot of the time. This locally optimal code is not always generated because:
- gcc fails to detect that
(n << 2)-n+1is equivalent to(n << 1)+n+1and generates the sequenceleal 0(,%rax,4), %edx ; subl %eax, %edx ; addl $1, %edx(I pointed this out to a gcc maintainer sometime ago, and he suggested reporting it as a bug). This 'bug' occurs three times in total. - For some forms of the calculation llvm generates globally better code by taking the else arm into consideration. For instance, when the calculation is written as
n += (n << 1) +1llvm deduces that(n << 1)and the2*nin theelseare equivalent, evaluates this value into a register before performing the conditional test thus removing the need for an unconditional jump around the 'else' code:leal (%rax,%rax), %ecx testb $1, %al je .LBB0_8 # BB#7: orl $1, %ecx # deduced ecx is even, arithmetic unit not needed! addl %eax, %ecx .LBB0_8:
This more efficient sequence occurs nine times in total.
The most optimal sequence was generated by gcc:
testb $1, %dl leal (%rdx,%rdx), %eax je .L6 leal 1(%rdx,%rdx,2), %eax .L6: |
with llvm and pre 4.6 versions of gcc generating the more traditional form (above, gcc 4.6.1 assumes that the 'then' arm is the most likely to be executed and trades off a leal against a very slow jmp):
testb $1, %al je .LBB0_5 # BB#4: leal 1(%rax,%rax,2), %eax jmp .LBB0_6 .LBB0_5: addl %eax, %eax .LBB0_6: |
There is still room for improvement, perhaps by using the conditional move instruction (which gcc actually generates within the not-very-clever code sequence for (n / 2)*2 != n) or by using the fact that eax already holds 2*n (the potential saving would come through a reduction in complexity of the internal resources needed to execute the instruction).
llvm insists on storing the calculated value back into n at the end of every statement. I'm not sure if this is a bug or a feature designed to make runtime debugging easier (if so it ought to be switched off by default).
Missed optimization opportunities (not intended to be part of this benchmark and if encountered would require a restructuring of the test source) include noticing that if  is odd then
  is always even, creating the opportunity to perform the following multiply by 2 without an if test.
Perhaps one day, compilers will figure out when a program is calculating pi and generate code that uses the best known algorithm. In the meantime, I am interested in hearing suggestions for additional different-algorithm-same-code benchmarks.
Quality of data analysis: two recent papers
Software engineering research has and continues to suffer from very low quality data analysis. The underlying problem is that practitioners are happy to go along with the status quo, not bothering to learn basic statistics or criticize data analysis in papers they are asked to review. Two recent papers I have read spring out as being at opposite ends of the spectrum.
In their paper A replicated survey of IT software project failures Khaled El Emam and A. Günes Koru don’t just list the mean values for the responses they get they also give the 95% confidence bounds on those values. At a superficial level this has the effect of making their results look much less interesting; for instance a quick glance at Table 3 “Reasons for project cancellation” suggests there is a significant difference between “Lack of necessary technical skills” at 22% and “Over schedule” at 17% but a look at the 95% confidence bounds, (6%–48%) and (4%–41%) respectively, shows that almost nothing can be said about the relative contribution of these two reasons (why publish these numbers, because nothing else has been published and somebody has to start somewhere). The authors understand the consequences of using a small sample size and have the integrity to list the confidence bounds rather than leave the reader to draw completely unjustified conclusions. I wish everybody was as careful and upfront about their analysis as these authors.
The paper Assessing Programming Language Impact on Development and Maintenance: A Study on C and C++ by Pamela Bhattacharya and Iulian Neamtiu takes some interesting ideas and measurements and completely mangles the statistical analysis (something the conference’s reviewers should have picked up on).
I encourage everybody to measure code and do statistical analysis. It looks like what happened here is that a PhD student got in over her head and made lots of mistakes, something that happens to us all when learning a new subject. The problem is that these mistakes made it through into a published paper and its conclusions are likely to repeated (these conclusions may or may not be true and it may or may not be possible to reliably test them from the data gathered, but the analysis presented in the paper faulty and so its conclusions cannot be trusted). I hope the authors will reanalyze their data using the appropriate techniques and publish an updated version of the paper.
Some of the hypothesis being tested include:
- C++ is replacing C as a main development language. The actual hypothesis tested is the more interesting question: “Is the percentage of C++ in projects that also contain substantial amounts of C growing at the expense of C?”
So the unit of measurement is the project and only four of these are included in the study; an extremely small sample size that must have an error bound of around 50% (no mention of error bounds in the paper). The analysis of the data claims to use linear regression but seems completely confused, lets not get bogged down in the details but move on to other more obvious mistakes.
- C++ code is of higher internal quality than C code. The data consists of various source code metrics, ignoring whether these are a meaningful measure of quality, lets look at how the numbers are analysed. I was somewhat surprised to read: “the distributions of complexity values … are skewed, thus arithmetic mean is not the right indicator of an ongoing trend. Therefore, …, we use the geometric mean …” While the arithmetic mean might not be a useful indicator (I have trouble seeing why not), use of the geometric mean is bizarre and completely wrong. Because of its multiplicative nature the geometric mean of a set of values having a fixed arithmetic mean decreases as its variance increases. For instance, the two sets of values (40, 60) and (20, 80) both have an arithmetic mean of 50, while their geometric means are 48.98979 (i.e.,
^0.5") ) and 40 (i.e.,
) and 40 (i.e., ^0.5") ) respectively.
) respectively.
So if anything can be said about the bizarre idea of comparing the geometric mean of complexity metrics as they change over time, it is that increases/decreases are an indicator of decrease/increase in variance of the measurements.
- C++ code is less prone to bugs than C code. The statistical analysis here made a common novice mistake. The null hypothesis tested was: “C code has lower or equal defect density than C++ code.” and this was rejected. The incorrect conclusion drawn was that “C++ code is less prone to bugs than C code.” Statistically one does not follow from the other, the data could be inconclusive and the researchers should have tested this question as the null hypothesis if this is the claim they wanted to make. There are also lots of question marks over other parts of the analysis, but this is the biggest blunder.
Quality comparison of floating-point maths libraries
What is the best way to compare the quality of floating-point math libraries (e.g., sin, cos and log)? The traditional approach for evaluating the quality of an algorithm implementing a mathematical function is based on mathematics; methods have been developed to calculate the maximum error between the calculated and the actual value. The answer produced by this approach does not say anything about how frequently this maximum error will occur, only that it occurs at least once.
The log (natural logarithm) is probably the most frequently used mathematical function and I decided to compare a few implementations; R statistical package version 2.11.1 and glibc (libm version 2.11.2) both running under Suse 11.3 on an AMD Athlon 64 X2, and Cygwin version 1.7.1 under Windows XP SP 2 on another AMD Athlon 64 X2.
The algorithm often used to implement mathematical functions involves evaluating a polynomial expression (e.g., Chebyshev polynomials) within a small range of values (various methods are used to map the argument into this range and then scale the calculated result). I decided to initially treat the implementations under test as black boxes and did not know the ranges they used; a range of 0.1 to 1.0 seemed like a good idea and I generated all single precision floating-point values between these two bounds (all 28,521,267 of them, with each adjacent pair still having  double precision values between them).
#include <math.h> #include <stdio.h> int main(int argc, char *argv[]) { float val = 0.1, max_val = 1.0; while (val < max_val) { printf("%12.10f\n", val); val=nextafterf(val, 1.1); } } |
This list of 28 million values was fed as input to three programs:
- bc, which was used to generate the list of assumed to be correct logarithm of these 28 million values. R supports 64-bit IEEE compliant floating-point values, as do the C compilers/libraries used, and the number of decimal digits supported in this representation is 15. To provide greater accuracy to compare against the values generated by bc contained 17 digits, an extra two decimal digits over the IEEE values.
scale=17
while ((val=read() > 0))
   l(val)
- A C program.
#include <math.h>
#include <stdio.h>

int main(int argc, char *argv[])
{
double val;

while (!feof(stdin))
   {
   scanf("%lf", &val);
   printf("%17.15f\n", log(val));
   }
}
- A R program.
base_range=file("stdin", open="r")

base_val=as.numeric(readLines(base_range, n=1))
while (length(base_val) != 0)
   {
   cat(format(log(base_val), nsmall=15), file=stdout())
   cat("\n", file=stdout())

   base_val=as.numeric(readLines(base_range, n=1))
   }
The output of the C and R programs was then compared against the output from bc; which unfortunately creates a dependency on the accuracy of the C & R binary to decimal output routines (the subsequent comparison process gets around the decimal-to-binary input problem by reading the log values as strings and comparing the last few digits of each respective value). Accurate floating-point I/O needs something like hexadecimal floating constants.
Plotting the number of computed values of log that differ by a given amount from the value computed by bc, we get (values whose error is below -50 will be rounded down and those above 50 rounded up, ignoring the issue of round to even):
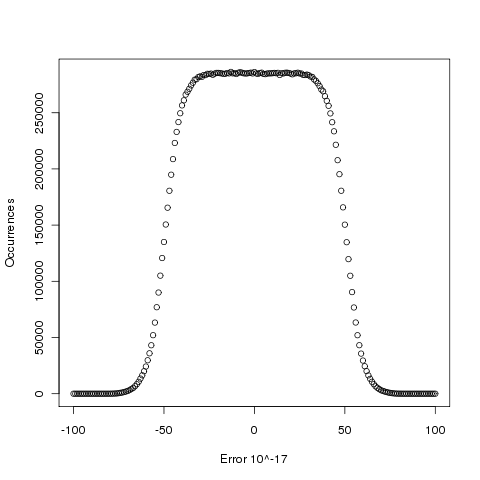
The results (raw data for R, Linux C and Cygwin C) show that around 5.6% of values are off by one in the last (15th) digit (Cygwin was slightly worse at 5.7%). The results for R/Linux C were almost identical and a quick check of the R source tree showed that R calls the C library function to evaluate log (it is a bit worrying that R is dependent on the host maths library, they should think about replacing this dependency by something like MPFR tout suite; even though the 64-bit glibc library is of very high quality it still has an environmental dependency).
Being off by one in the last decimal place is unlikely to keep many people awake at night. But if we want a measure of quality, is percentage of inaccurate values a useful measure of math library quality? Provided it is coupled with the amount of inaccuracy, I think this is a useful measure.
Recent Comments