Archive
Advertised prices of desktop computers during the 1990s
The 1990s was a decade of dramatic improvements in desktop computer capacity and performance. The difference in performance between the newest and current systems was clearly visible from the rate at which compiler messages zipped up the screen. How did the price of these desktop systems change during this period?
Magazine adverts are sometimes the only publicly available source of information about historical products. For instance, the characteristics of IBM PC compatible computers (e.g., price, RAM, clock frequency) over the first 20 years since they were first introduced in the early 1980s.
During the 1980s and 1990s BYTE magazine was the leading monthly computer magazine in the US, with a strong following here in the UK. Each issue contained around 400+ pages, and was packed with adverts from all the major hardware/software vendors. The last issue appeared in Jul 1998. The Internet Archive contains a scanned copy of every issue.
In 1987 Dell Computer Corp started selling cut-price computers direct to customers. Dell ran adverts in every issue of BYTE from June 1988 until the magazine closed. Gateway was another company in this market, and also regularly advertised in BYTE.
The text information present in adverts is often embedded within graphical content. My interest in this information has not been sufficient to manually type it in. LLMs are now available, and these have proven to be remarkably effective at extracting information from images.
The following advert shows how information specific to a particular computer system appears once, along with prices for particular options. Grok correctly populates a csv file containing information on four systems.
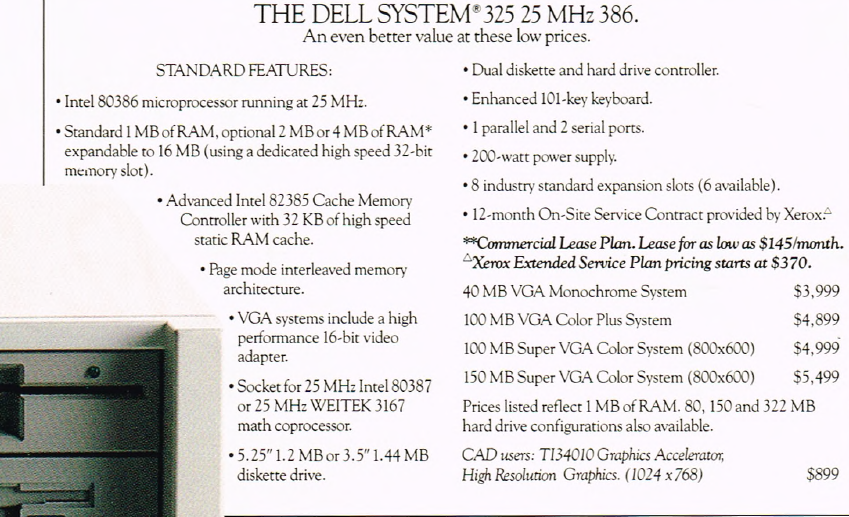
I did not attempt to ask LLMs to extract the Dell/Gateway ads from a 400+ page magazine. Manual extraction of the advert pages also gave me the opportunity to scan for other ads (a few companies advertised sporadically, e.g., Micron). Some experimentation showed that Grok returned the most accurate/reliable data.
System configuration information, for Dell and Gateway, was extracted from their adverts that appeared in the June/December issues for every year between 1988 and 1998.
Adverts show the price of particular system configurations. Typically, vendors list prices for minimal systems, along with the incremental price for more memory or a larger hard disc.
The plot below shows the original US dollar prices of 500 systems appearing in Dell/Gateway/Micron/Zeos BYTE adverts during the 1990s (code+data):
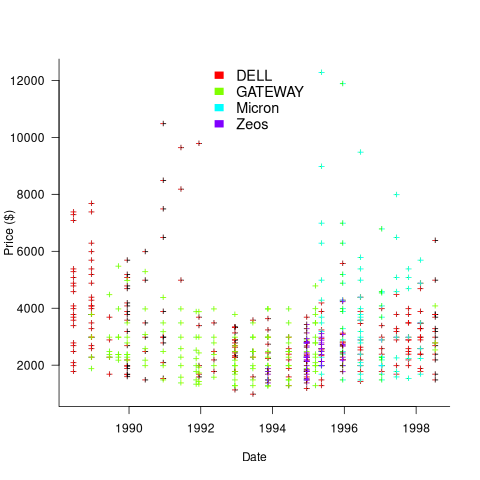
These prices have not been adjusted for inflation, and show the numeric values often ending in “99” that appeared in the adverts.
Once a ballpark figure is established in the market for the price of a product, vendors are loath to decrease it. Higher priced systems generally have higher profit margins.
Dell starts by offering systems whose price varies by a factor of four, and then settles into a narrower range of prices (presumably based on feedback from volume of sales). Micro appears to be similarly experimenting around 1996.
In the UK, when the price of low-end systems reached £1,000, rather than continuing to reduce the price, sales outlets started adding a printer to a complete package, keeping the price at around £1,000 (which families were willing to pay). Eventually the cost of a printer was not enough to fill the price gap.
The plot below shows the advertised disk size and amount of RAM installed in 500 systems advertised during the 1990s (the 1.44MB disk is a floppy drive only system; code+data):
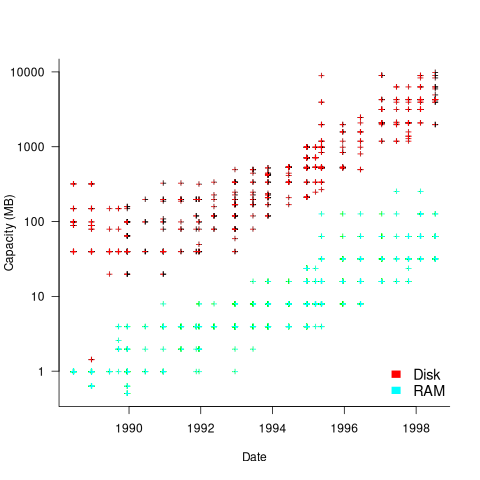
The well-known exponential capacity growth is clearly visible.
The data shows that during the 1990 there was no consistent decrease in the numeric value of the advertised price of desktop computers, which fluctuated (more data is needed to separate out the effects of functionality added to top-end systems), while actual prices decreased by 30% over the decade due to inflation. The capacity of the disk and RAM installed in desktop systems increased exponentially (also cpu clock speed; this plot is not shown).
The Hedonic index is a process used by economists to model the interaction of a product’s price and its characteristics.
CPU frequency not relevant to SPEC benchmark performance
Despite the end of Dennard scaling around 2005-7 computer performance, as measured by the SPEC cpu benchmarks, continues to improve. What is driving this ongoing increase in performance, given that cpu clock rates have stopped increasing?
The plot below shows 9,161 results from the SPEC CPU integer benchmark, plus the fitted regression line  (code+data):
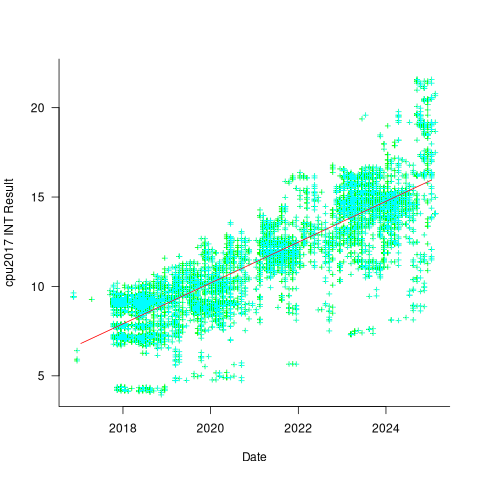
There is a scattering of benchmark results because manufacturers offer systems having a range of performance.
Possible factors driving the ongoing increases in system performance include increased DRAM-memory bandwidth, and cpu improvements such as larger caches and more accurate branch prediction. While Moore’s law (i.e., rate of growth of the number of transistors on a chip) has slowed down a lot, the number of transistors in a processor chip has continued to increase (many of these transistors have been used to build chips that contain multiple cpu cores).
The SPEC benchmark result data includes a lot of information about the system that ran the benchmarks, including: processor family/model, number of cpu cores, clock frequency, amount of memory installed and its type.
Results from SPEC CPU2017, the current version of the benchmark, are available from the start of 2017 to now. The following analysis uses these results. Results from the SPEC CPU2006 benchmark are also available, and a regression model fitted to the results from the 780 systems that ran both benchmarks, gives the mapping from CPU INT 2006 to CPU INT 2017 as:  .
.
The processor information in the results file usually specifies family name plus model number/name. The model information usually correlates with clock frequency, perhaps cache size, or gpu support; some examples below.
    AMD EPYC 4464P                AMD EPYC 4564P
    AMD Ryzen 9 7950X             AMD Ryzen 7 5800X
    Intel Xeon Platinum 8490H     Intel Xeon Gold 6438N
Intel Xeon E3-1220 v3 Intel Xeon E5-2697 v3 |
The family name is sufficient for an initial analysis. Details of any cache size differences between models can always be included in a later analysis. The following table shows the number of processor x86 based families present in the 2017 INT results (total 9,161):
           AMD EPYC           AMD Ryzen               Intel
               1475                   7                   1
      Intel Celeron       Intel Core i3       Intel Core i5
                 16                  31                   2
      Intel Core i7       Intel Pentium          Intel Xeon
                  1                  30                 605
  Intel Xeon Bronze        Intel Xeon D       Intel Xeon E3
                167                  12                  16
      Intel Xeon E5       Intel Xeon E7     Intel Xeon Gold
                  3                   2                3994
Intel Xeon Platinum   Intel Xeon Silver        Intel Xeon W
1822 969 8 |
The memory information usually includes total bytes, number of memory sticks and interface standard (e.g., DDR2/3/4/5); some examples below.
    64 GB (2 x 32 GB 2Rx4 PC5-5600B-R, running at 5200)
    64 GB (2 x 32 GB 2Rx8 PC4-3200AA-E)
    256 GB (8*1GB DDR2-400 DIMMS per 4 core module)
    192 GB (4 x 12 x 4 GB DDR3-1333R, ECC, CL9)
    32 GB (8 x 4 GB Dual-rank PC2-6400 CL5-5-5 FB-DIMMs)
24 GB (6 x 4 GB DDR3-1333 downclocked to 1066 MHz) |
The memory bandwidth can be calculated from the interface standard used. The names of modern DRAM interface standards start with either DDR or PC, and a number, a hyphen and then another number. The values appearing in the SPEC results don’t always follow the naming rules listed in the standard (e.g., last number of a PC name using the corresponding DDR number), and in a few cases a digit was dropped from the last number. Where possible the ‘obvious’ edits were made (sometimes values were just wrong), see code for details. The following table shows the number of interface standards represented in the 2017 CPU INT results (total 9,161; in the 2006 results DDR names predominated):
PC4-2400  PC4-2666  PC4-2933  PC4-3200  PC4-4800 PC5-11200 PC5-12800
      26      2248      2163      2080         6         2         3
PC5-4800  PC5-5200  PC5-5600  PC5-6400     PC5-8  PC5-8800
1735 5 653 233 2 5 |
Once the memory is identified, its bandwidth can be looked up (bespoke memory stick clock rates were ignored). Fitting a regression model to the data, with the CPU INT (cpu integer benchmark) result as the outcome, we get (using a multiplicative model allows each factor to have a percentage impact; code+data):

where:  is the memory bandwidth in megabytes per second,
  is cpu frequency in MHz, and
  is the fitted constant for each processor family.
The cpu frequency varies between 1.7 and 4.7 GHz (a ratio of 1:2.8), the memory bandwidth between 19,200 and 51,200 MB/s (a ratio of 1:2.7), and processor family performance impact ratio was 1:2.2. Given the fitted power laws, this range of cpu frequencies could impact performance by around 22%, while the range of memory bandwidth could impact performance by a factor of two.
This fitted model implies that cpu frequency changes, over the range supported by systems since 2017, have almost no impact on the performance of integer-based programs, i.e., no floating point.
I thought there might be a correlation between memory bandwidth and cpu frequency (because vendors would use faster memory in systems with faster cpus). The plot below shows CPU frequency against memory bandwidth (both axis use linear scales), plus a fitted regression line in red (code+data):
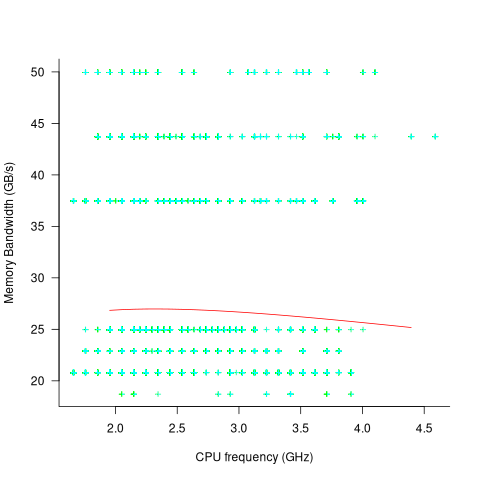
I was wrong. There does not appear to be any connection between a system’s cpu frequency and its memory bandwidth.
These days, most x86 chips include multiple processors, with each processor taking a share of memory bandwidth. Increasing memory bandwidth is essential, if all cores are to be kept busy.
The SPEC CPU benchmark measures the performance of a single processor. If only one of the cpu cores available on a system is being used, that core has the benefit of memory bandwidth that usually has to be shared.
To what extent is a single core benchmark relevant today? I suspect that most programs run on a single core, but developers sometimes attempt to spread cpu intensive programs over multiple cores. As always, data is needed.
The SPEC benchmark is useful for cpu designers (the original target market) and compiler writers wanting to measure the impact of fancy new optimizations.
Memory bandwidth: 1991-2009
The Stream benchmark is a measure of sustained memory bandwidth; the target systems are high performance computers. Sustained in the sense of distance running, rather than a short sprint (the term for this is peak memory bandwidth and occurs when the requested data is in cache), and bandwidth in the sense of bytes of memory read/written per second (implemented using chunks the size of a double precision floating-point type). The dataset contains 1,018 measurements collected between 1991 and 2009.
The dominant characteristic of high performance computing applications is looping over very large arrays, performing floating-point operations on all the elements. A fast floating-point arithmetic unit has to be connected to a memory subsystem that can keep it fed with new floating-point values and write back computed values.
The Stream benchmark, in Fortran and C, defines several arrays, each containing max(1e6, 4*size_of_available_cache) double precision floating-point elements. There are four loops that iterate over every element of the arrays, each loop containing a single statement; see Fortran code in the following table (q is a scalar, array elements are usually 8-bytes, with add/multiply being the floating-point operations):
Name Operation Bytes FLOPS Copy a(i) = b(i) 16 0 Scale a(i) = q*b(i) 16 1 Sum a(i) = b(i) + c(i) 24 1 Triad a(i) = b(i) + q*c(i) 24 2 |
A system’s memory bandwidth will depend on the speed of the DRAM chips, the performance of the devices that transport bytes to the cpu, and the ability of the cpu to handle incoming traffic. The Stream data contains 21 columns, including: the vendor, date, clock rate, number of cpus, kind of memory (i.e., shared/distributed), and the bandwidth in megabytes/sec for each of the operations listed above.
How does the measured memory bandwidth change over time?
For most of the systems, the values for each of Copy, Scale, Sum, and Triad are very similar. That the simplest statement, Copy, is sometimes a bit faster/slower than the most complicated statement, Triad, shows that floating-point performance is much smaller than the time taken to read/write values to memory; the performance difference is random variation.
Several fitted regression models explain over half of the variance in the data, with the influential explanatory variables being: clock speed, date, type of system (i.e., PC/Mac or something much more expensive). The plot below shows MB/sec for the Copy loop, with three fitted regression models (code+data):
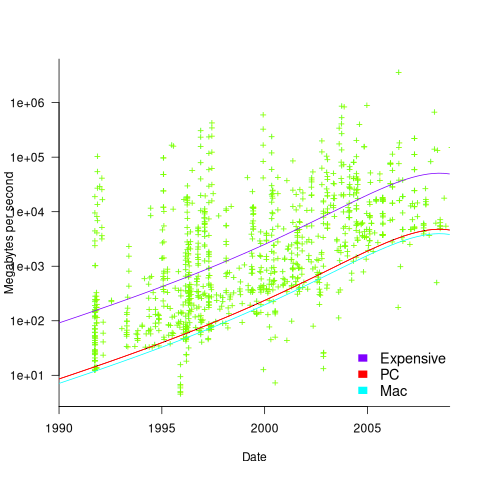
Fitting these models first required fitting a model for cpu clock rate over time; predictions of mean clock rate over time are needed as input to the memory bandwidth model. The three bandwidth models fitted are for PCs (189 systems), Macs (39 systems), and the more expensive systems (785; the five cluster systems were not fitted).
There was a 30% annual increase in memory bandwidth, with the average expensive systems having an order of magnitude greater bandwidth than PCs/Macs.
Clock rates stopped increasing around 2010, but go faster DRAM standards continue to be published. I assume that memory bandwidth continues to increase, but that memory performance is not something that gets written about much. The memory bandwidth on my new system is  MB/sec. This 2024 sample of one is 3.5 times faster than the average 2009 PC bandwidth, which is 100 times faster than the 1991 bandwidth.
The LINPACK benchmarks are the traditional application oriented cpu benchmarks used within the high performance computer community.
The 2024 update to my desktop system
I have just upgraded my desktop system. As you can see from the picture below, it is a bespoke system; the third system built using the same chassis.
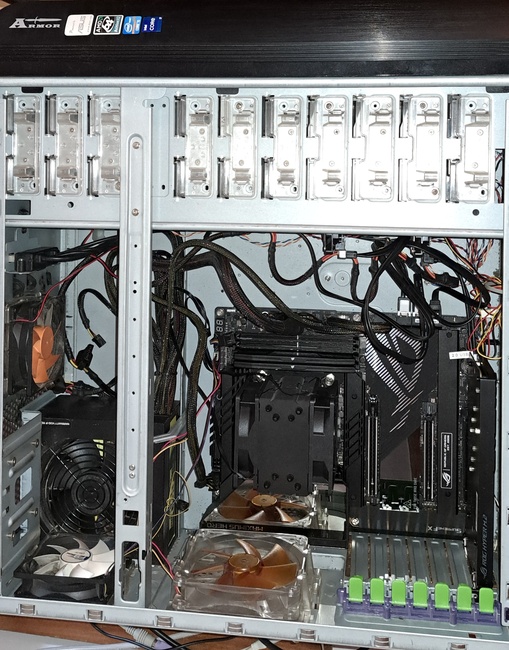
The 11 drive bays on the right are configured for six 5.25-inch and five 3.5-inch disks/CD/DVD/tape drives, there is a drive cage that fits above the power supply (top left) that holds another three 3.5-inch devices. The central black rectangle with two sets of four semicircular caps (fan above/below) is the cpu cooling tower, with two 32G memory sticks immediately to its right. The central left fan is reflected in a polished heatsink.
Why so many bays for disks?
The original need, in 2005 (well before GitHub), was for enough storage to hold the source code available, via ftp, from various hosting sites that were springing up, hence the choice of the Thermaltake Armour Series VA8000BWS Supertower. The first system I built contained six 400G Barracuda drives
The original power supply, a Thermaltake Silent Purepower 680W PSU, with its umpteen power connectors is still giving sterling service (black box with black fan at top left).
When building a system, I start by deciding on the motherboard. Boards supporting 6+ SATA connectors were once rare, but these days are more common on high-end systems. I also look for support for the latest cpu families and high memory bandwidth. I’m not a gamer, so no interest in graphics cards.
The three systems are:
- in 2005, an ASUS A8N-SLi Premium Socket 939 Motherboard, an AMD Athlon 64 X2 Dual-Core 4400 2.2Ghz cpu, and Corsair TWINX2048-3200C2 TwinX (2 x 1GB) memory. A Red Hat Linux distribution was installed,
- in 2013, an intermittent problem appeared on the A8N motherboard, so I upgraded to an ASUS P8Z77-V 1155 Socket motherboard, an Intel Core i5 Ivy Bridge 3570K – 3.4 GHz cpu, and Corsair CMZ16GX3M2A1600C10 Vengeance 16GB (2x8GB) DDR3 1600 MHz memory. Terabyte 3.25-inch disk drives were now available, and I installed two 2T drives. A openSUSE Linux distribution was installed.
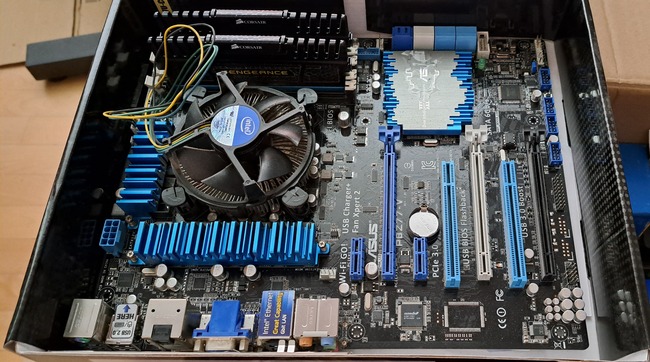
The picture below shows the P8Z77-V, with cpu+fan and memory installed, sitting in its original box. This board and the one pictured above are the same length/width, i.e., the ATX form factor. This board is a lot lighter, in color and weight, than the Z790 board because it is not covered by surprisingly thick black metal plates, intended to spread areas of heat concentration,
- in 2024, there is no immediate need for an update, but the 11-year-old P8Z77 is likely to become unreliable sooner rather than later, better to update at a time of my choosing. At £400 the ASUS ROG Maximus Z790 Hero LGA 1700 socket motherboard is a big step up from my previous choices, but I’m starting to get involved with larger datasets and running LLMs locally. The Intel Core i7-13700K was chosen because of its 16 cores (I went for a hefty cooler upHere CPU Air Cooler with two fans), along with Corsair Vengeance DDR5 RAM 64GB (2x32GB) 6400 memory. A 4T and 8T hard disk, plus a 2T SSD were added to the storage system. The Linux Mint distribution was installed.
The last 20-years has seen an evolution of the desktop computer I own: roughly a factor of 10 increase in cpu cores, memory and storage. Several revolutions occurred between the roughly 20 years from the first computer I owned (an 8-bit cpu running at 4 MHz with 64K of memory and two 360K floppy drives) and the first one of these desktop systems.
What might happen in the next 20-years?
Will it still be commercially viable for companies to sell motherboards? If enough people switch to using datacenters, rather than desktop systems, many companies will stop selling into the computer component market.
LLMs perform simple operations on huge amounts of data. The bottleneck is transferring the data from memory to the processors. A system where simple compute occurs within the memory system would be a revolution in mainstream computer architecture.
Motherboards include a socket to support a specialised AI chip, like the empty socket for Intel’s 8087 on the original PC motherboards, is a reuse of past practices.
The Whitehouse report on adopting memory safety
Last month’s Whitehouse report: BACK TO THE BUILDING BLOCKS: A Path Towards Secure and Measurable Software “… outlines two fundamental shifts: the need to both rebalance the responsibility to defend cyberspace and realign incentives to favor long-term cybersecurity investments.”
From the abstract: “First, in order to reduce memory safety vulnerabilities at scale, … This report focuses on the programming language as a primary building block, …” Wow, I never expected to see the term ‘memory safety’ in a report from the Whitehouse (not that I recall ever reading a Whitehouse report). And, is this the first Whitehouse report to talk about programming languages?
tl;dr They mistakenly to focus on the tools (i.e., programming languages), the focus needs to be on how the tools are used, e.g., require switching on C compiler’s memory safety checks which currently default to off.
The report’s intent is to get the community to progress from defence (e.g., virus scanning) to offence (e.g., removing the vulnerabilities at source). The three-pronged attack focuses on programming languages, hardware (e.g., CHERI), and formal methods. The report is a rallying call to the troops, who are, I assume, senior executives with no little or no knowledge of writing software.
How did memory safety and programming languages enter the political limelight? What caused the Whitehouse claim that “…, one of the most impactful actions software and hardware manufacturers can take is adopting memory safe programming languages.”?
The cited reference is a report published two months earlier: The Case for Memory Safe Roadmaps: Why Both C-Suite Executives and Technical Experts Need to Take Memory Safe Coding Seriously, published by an alphabet soup of national security agencies.
This report starts by stating the obvious (at least to developers): “Memory safety vulnerabilities are the most prevalent type of disclosed software vulnerability.” (one Microsoft reports says 70%). It then goes on to make the optimistic claim that: “Memory safe programming languages (MSLs) can eliminate memory safety vulnerabilities.”
This concept of a ‘memory safe programming language’ leads the authors to fall into the trap of believing that tools are the problem, rather than how the tools are used.
C and C++ are memory safe programming languages when the appropriate compiler options are switched on, e.g., gcc’s sanitize flags. Rust and Ada are not memory safe programming languages when the appropriate compiler options are switched on/off, or object/function definitions include the unsafe keyword.
People argue over the definition of memory safety. At the implementation level, it includes checks that storage is not accessed outside of its defined bounds, e.g., arrays are not indexed outside the specified lower/upper bound.
I’m a great fan of array/pointer bounds checking and since the 1980s have been using bounds checking tools to check my C programs. I found bounds checking is a very cost-effective way of detecting coding mistakes.
Culture drives the (non)use of bounds checking. Pascal, Ada and now Rust have a culture of bounds checking during development, amongst other checks. C, C++, and other languages have a culture of not having switching on bounds checking.
Shipping programs with/without bounds checking enabled is a contentious issue. The three main factors are:
- Runtime performance overhead of doing the checks (which can vary from almost nothing to a factor of 5+, depending on the frequency of bounds checked accesses {checks don’t need to be made when the compiler can figure out that a particular access is always within bounds}). I would expect the performance overhead to be about the same for C/Rust compilers using the same compiler technology (as the Open source compilers do). A recent study found C (no checking) to be 1.77 times faster, on average, than Rust (with checking),
- Runtime memory overhead. Adding code to check memory accesses increases the size of programs. This can be an issue for embedded systems, where memory is not as plentiful as desktop systems (recent survey of Rust on embedded systems),
- Studies (here and here) have found that programs can be remarkably robust in the presence of errors. Developers’ everyday experience is that programs containing many coding mistakes regularly behave as expected most of the time.
If bounds checking is enabled on shipped applications, what should happen when a bounds violation is detected?
Many bounds violations are likely to be benign, and a few not so. Should users have the option of continuing program execution after a violation is flagged (assuming they have been trained to understand the program message they are seeing and are aware of the response options)?
Java programs ship with bounds checking enabled, but I have not seen any studies of user response to runtime errors.
The reason that C/C++ is the language used to write so many of the programs listed in vulnerability databases is that these languages are popular and widely used. The Rust security advisory database contains few entries because few widely used programs are written in Rust. It’s possible to write unsafe code in Rust, just like C/C++, and studies find that developers regularly write such code and security risks exist within the Rust ecosystem, just like C/C++.
There have been various attempts to implement bounds checking in x86
processors. Intel added the MPX instruction, but there were problems with the specification, and support was discontinued in 2019.
The CHERI hardware discussed in the Whitehouse report is not yet commercially available, but organizations are working towards commercial products.
Extracting numbers from a stacked density plot
A month or so ago, I found a graph showing a percentage of PCs having a given range of memory installed, between March 2000 and April 2020, on a TechTalk page of PC Matic; it had the form of a stacked density plot. This kind of installed memory data is rare, how could I get the underlying values (a previous post covers extracting data from a heatmap)?
The plot below is the image on PC Matic’s site:
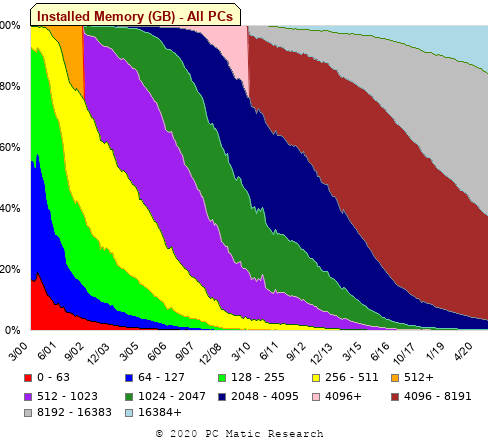
The change of colors creates a distinct boundary between different memory capacity ranges, and it ought to be possible to find the y-axis location of each color change, for a given x-axis location (with location measured in pixels).
The image was a png file, I loaded R’s png package, and a call to readPNG created the required 2-D array of pixel information.
library("png")
img=readPNG("../rc_mem_memrange_all.png") |
Next, the horizontal and vertical pixel boundaries of the colored data needed to be found. The rectangle of data is surrounded by white pixels. The number of white pixels (actually all ones corresponding to the RGB values) along each horizontal and vertical line dramatically drops at the data image boundary. The following code counts the number of col points in each horizontal line (used to find the y-axis bounds):
horizontal_line=function(a_img, col)
{
lines_col=sapply(1:n_lines, function(X) sum((a_img[X, , 1]==col[1]) &
                                            (a_img[X, , 2]==col[2]) &
                                            (a_img[X, , 3]==col[3]))
                )

return(lines_col)
}

white=c(1, 1, 1)
n_cols=dim(img)[2]

# Find where fraction of white points on a line changes dramatically
white_horiz=horizontal_line(img, white)

# handle when upper boundary is missing
ylim=c(0, which(abs(diff(white_horiz/n_cols)) > 0.5))
ylim=ylim[2:3] |
Next, for each vertical column of pixels, at each x-axis pixel location, the sought after y value occurs at the change of color boundary in the corresponding vertical column. This boundary includes a 1-pixel wide separation color, which creates a run of 2 or 3 consecutive pixel color changes.
The color change is easily found using the duplicated function.
# Return y position of vertical color changes at x_pos
y_col_change=function(x_pos)
{
# Good enough technique to generate a unique value per RGB color
col_change=which(!duplicated(img[y_range, x_pos, 1]+
                          10*img[y_range, x_pos, 2]+
                         100*img[y_range, x_pos, 3]))

# Handle a 1-pixel separation line between colors.
# Diff is used to find these consecutive sequences.
y_change=c(1, col_change[which(diff(col_change) > 1)+1])

# Always return a vector containing max_vals elements.
return(c(y_change, rep(NA, max_vals-length(y_change))))
} |
Next, we need to group together the sequence of points that delimit a particular boundary. The points along the same boundary are all associated with the same two colors, i.e., the ones below/above the boundary (plus a possible boundary color).
The plot below shows all the detected boundary points, in black, overwritten by colors denoting the points associated with the same below/above colors (code):

The visible black pluses show that the algorithm is not perfect. The few points here and there can be ignored, but the two blocks at the top of the original image have thrown a spanner in the works for some range of points (this could be fixed manually, or perhaps it is possible to tweak the color extraction formula to work around them).
How well does this approach work with other stacked density plots? No idea, but I am on the lookout for other interesting examples.
Memory capacity growth: a major contributor to the success of computers
The growth in memory capacity is the unsung hero of the computer revolution. Intel’s multi-decade annual billion dollar marketing spend has ensured that cpu clock frequency dominates our attention (a lot of people don’t know that memory is available at different frequencies, and this can have a larger impact on performance that cpu frequency).
In many ways memory capacity is more important than clock frequency: a program won’t run unless enough memory is available but people can wait for a slow cpu.
The growth in memory capacity of customer computers changed the structure of the software business.
When memory capacity was limited by a 16-bit address space (i.e., 64k), commercially saleable applications could be created by one or two very capable developers working flat out for a year. There was no point hiring a large team, because the resulting application would be too large to run on a typical customer computer. Very large applications were written, but these were bespoke systems consisting of many small programs that ran one after the other.
Once the memory capacity of a typical customer computer started to regularly increase it became practical, and eventually necessary, to create and sell applications offering ever more functionality. A successful application written by one developer became rarer and rarer.
Microsoft Windows is the poster child application that grew in complexity as computer memory capacity grew. Microsoft’s MS-DOS had lots of potential competitors because it was small (it was created in an era when 64k was a lot of memory). In the 1990s the increasing memory capacity enabled Microsoft to create a moat around their products, by offering an increasingly wide variety of functionality that required a large team of developers to build and then support.
GCC’s rise to dominance was possible for the same reason as Microsoft Windows. In the late 1980s gcc was just another one-man compiler project, others could not make significant contributions because the resulting compiler would not run on a typical developer computer. Once memory capacity took off, it was possible for gcc to grow from the contributions of many, something that other one-man compilers could not do (without hiring lots of developers).
How fast did the memory capacity of computers owned by potential customers grow?
One source of information is the adverts in Byte (the magazine), lots of pdfs are available, and perhaps one day a student with some time will extract the information.
Wikipedia has plenty of articles detailing cpu performance, e.g., Macintosh models by cpu type (a comparison of Macintosh models does include memory capacity). The impact of Intel’s marketing dollars on the perception of computer systems is a PhD thesis waiting to be written.
The SPEC benchmarks have been around since 1988, recording system memory capacity since 1994, and SPEC make their detailed data public 🙂 Hardware vendors are more likely to submit SPEC results for their high-end systems, than their run-of-the-mill systems. However, if we are looking at rate of growth, rather than absolute memory capacity, the results may be representative of typical customer systems.
The plot below shows memory capacity against date of reported benchmarking (which I assume is close to the date a system first became available). The lines are fitted using quantile regression, with 95% of systems being above the lower line (i.e., these systems all have more memory than those below this line), and 50% are above the upper line (code+data):
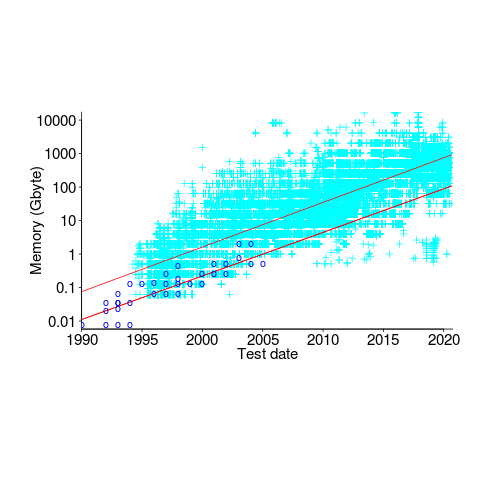
The fitted models show the memory capacity doubling every 845 or 825 days. The blue circles are memory that comes installed with various Macintosh systems, at time of launch (memory doubling time is 730 days).
How did applications’ minimum required memory grow over time? I have a patchy data for a smattering of products, extracted from Wikipedia. Some vendors probably required customers to have a fairly beefy machine, while others went for a wider customer base. Data on the memory requirements of the various versions of products launched in the 1990s is very hard to find. Pointers very welcome.
Main memory: the crucial component that vendors don’t mention
CPU performance hogs the limelight when people discuss the year-on-year increases in computing power that used to occur.
This focus on cpu performance was/is driven by marketing, the people with the money either don’t want customers thinking about the performance impact of main memory size or speed, or want them to treat the processor as the most important component of a computer. Vendors want processor performance to drive customer purchase decisions.
Hardware manufacturers used to entice new customers with low cost machines, containing minimal memory. Once a customer started to use their shiny new computer, they found that it did save them lots of time and money, but also they needed more memory (which could only be brought from the manufacturer and was not cheap).
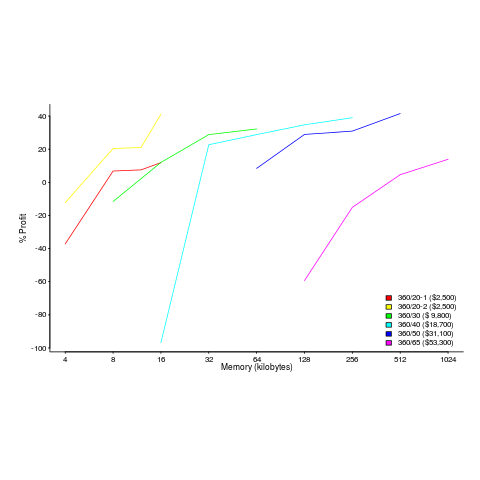
The plot below shows the prices IBM charged for System 360s, in 1966. Anti-trust investigations uncover all kinds of interesting data, like selling low-spec equipment at a loss to entice customers and make life difficult for competitors (code+data for all plots).
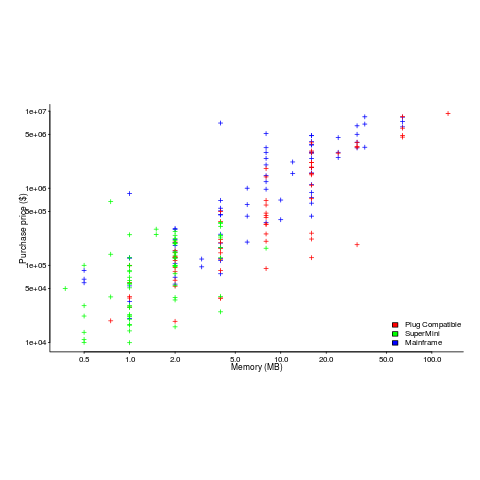
The plot below (data from the 19 Aug 1985 issue of ComputerWorld) shows how the price of computers increased as the minimum about of memory they supported increased.
Yes, in 1985 top end computers came with over 50M of memory; but most customers thought themselves lucky if they had a few megabytes.
If the processor is slow, it just takes longer for programs to run. If the computer does not have enough memory, programs cannot run. For most applications memory requirements are addressed first, followed by processor performance; memory requirements is the number one issue. The optimizations that commercial compilers could perform were limited by the memory capacity of developer machines.
Intel’s main line of business used to be selling memory chips, but these chips became commodity items as more companies entered the market; Intel bet the farm on selling processors and the rest is history. As a seller of a unique product it was/is in Intel’s interest to spend lots of money on marketing the benefits of processor performance; sellers of commodity items (such as memory chips) don’t have nearly as much to gain from generic product marketing, because customers may choose to buy from other sellers (in such markets sellers have to concentrate on marketing themselves).
Memory capacity/speed and cpu speed are two aspects of system performance; they need to be balanced to meet customer drive application requirements. The plot below shows the SPEC cpu integer performance of 4,332 systems running at various clock rates; the colors denote the different peak memory transfer rates of the memory chips in these systems (code+data).
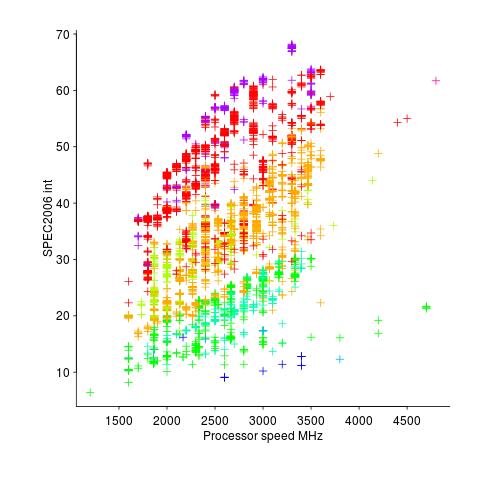
These days (and perhaps in the past, I don’t have any data), memory performance is a much better predictor of system performance, but vendors don’t have an incentive to market this fact.
CPUs also exhibit hardware faults
The cpu is the one element of a computing platform that people rarely treat as a source of error caused by physically malfunction, i.e., randomly flipping a bit in a register or instruction pipeline. I once worked on a compiler for the Mototola 88000 using a test platform that contained alpha silicon (i.e., not yet saleable components where some of the instructions were known not to work; the generated assembler code was piped through a sed script that mapped these instructions into an alternative instruction sequence that did work) and the cpus in a few of the hardware updates turned out to be temperature sensitive; some of the instructions changed their behavior when they got too hot. People who write compilers using alpha silicon learn to expect this sort of thing.
Quite a bit has been published on faults in other hardware components. Some of the best recent empirical hardware fault data and analysis I have seen is that published by Google engineers on hard disc and dram memory fault occurrences in their server farms. They might have a problem publishing such results for the cpus they use because these commodity items generally don’t have the ability to report any detailed fault data, they just die or one of the programs being executed crashes.
As device fabrication continues to shrink erroneous behavior caused by cosmic ray impact will become more and more common. Housing a computer farm at a high altitude might not be a good idea (at 7500 ft cosmic ray-induced neutrons that can lead to soft errors are 6.4 times more common than at sea level).
IBM’s Power4 chip (“Power4 System Design for High Reliability” by Bossen, Tendler and Reick) is one of the few that provides error checking of cache contents, while IBM’s System z9 is one of the very few that provide parity checking on the cpu registers (“Enhanced I/O subsystem recovery and availability on the IBM System z9” by Oakes et al).
One solution to the problem of unreliable cpu behavior is for the compiler to insert consistency checks into the generated code. Two such checking methods are:
- ‘Signature Analysis’ which performs consistency checks between signatures calculated at compile time and runtime. A signature is associated with every basic block with the current signature being derived from the execution history. This technique can detect spurious changes to the flow of control caused by a hardware glitch.
- ‘Error Detection by Duplicated Instructions’ generates code which duplicates the behavior of some instruction sequence and compares the result calculated by both sequences, i.e., a source language construct is executed twice and an error raised if the results are different. The parallel instruction sequences use different sets of registers on the same cpu and ideally the instructions are scheduled to exploit instruction level parallelism
At the moment cosmic-ray induced hardware faults are probably very small change compared to faults in the code. Will code quality increase to the point where cosmic-ray faults become an issue or will devices get so small that they have to be lead lined to prevent background radiation corrupting them? Let the race begin.
Recent Comments