Archive
Most percentages are more than half
Most developers think …
Most editors …
Most programs …
Linguistically most is a quantifier (it’s a proportional quantifier); a word-phrase used to convey information about the number of something, e.g., all, any, lots of, more than half, most, some.
Studies of most have often compared and contrasted it with the phrase more than half; findings include: most has an upper bound (i.e., not all), and more than half has a lower bound (but no upper bound).
A corpus analysis of most (432,830 occurrences) and more than half (4,857 occurrences) found noticeable usage differences. Perhaps the study’s most interesting finding, from a software engineering perspective, was that most tended to be applied to vague and uncountable domains (i.e., there was no expectation that the population of items could be counted), while uses of more than half almost always had a ‘survey results’ interpretation (e.g., supporting data cited as collaboration for 80% of occurrences; uses of most cited data for 19% of occurrences).
Readers will be familiar with software related claims containing the most qualifier, which are actually opinions that are not grounded in substantive numeric data.
When most is used in a numeric based context, what percentage (of a population) is considered to be most (of the population)?
When deciding how to describe a proportion, a writer has the choice of using more than half, most, or another qualifier. Corpus based studies find that the distribution of most has a higher average percentage value than more than half (both are left skewed, with most peaking around 80-85%).
When asked to decide whether a phrase using a qualifier is true/false, with respect to background information (e.g., Given that 55% of the birlers are enciad, is it true that: Most of the birlers are enciad?), do people treat most and more than half as being equivalent?
A study by Denić and Szymanik addressed this question. Subjects (200 took part, with results from 30 were excluded for various reasons) saw a statement involving a made-up object and verb, such as: “55% of the birlers are enciad.” They then saw a sentence containing either most or more than half, that was either upward-entailing (e.g., “More than half of the birlers are enciad.”), or downward-entailing (e.g., “It is not the case that more than half of the birlers are enciad.”); most/more than half and upward/downward entailing creates four possible kinds of sentence. Subjects were asked to respond true/false.
The percentage appearing in the first sentence of the two seen by subjects varied, e.g., “44% of the tiklets are hullaw.”, “12% of the puggles are entand.”, “68% of the plipers are sesare.” The percentage boundary where each subjects’ true/false answer switched was calculated (i.e., the mean of the percentages present in the questions’ each side of true/false boundary; often these values were 46% and 52%, whose average is 49; this is an artefact of the question wording).
The plot below shows the number of subjects whose true/false boundary occurred at a given percentage (code+data):
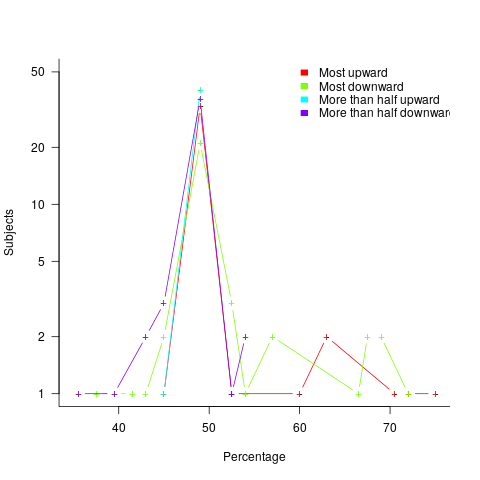
When asked, the majority of subjects had a 50% boundary for most/more than half+upward/downward. A downward entailment causes some subjects to lower their 50% boundary.
So now we know (subject to replication). Most people are likely to agree that 50% is the boundary for most/more than half, but some people think that the boundary percentage is higher for most.
When asked to write a sentence, percentages above 50% attract more mosts than more than halfs.
Most is preferred when discussing vague and uncountable domains; more than half is used when data is involved.
Influential philosophers of source code
Who is the most important/influential philosopher of source code? Source code, as far as I know, is not a subject that philosophers claim to be studying; but, the study of logic, language and the mind is the study of source code.
For many, Ludwig Wittgenstein would probably be the philosopher that springs to mind. Wittgenstein became famous as the world’s first Perl programmer, with statements such as: “If a lion could talk, we could not understand him.” and “Whereof one cannot speak, thereof one must be silent.”
Noam Chomsky, a linguist, might be another choice, based on his specification of the Chomsky hierarchy (which neatly categorizes grammars). But generative grammars (for which he is famous in linguistics) is about generating language, not understanding what has been said/written.
My choice for the most important/influential philosopher of source code is Paul Grice. A name, I suspect, that is new to most readers. The book to quote (and to read if you enjoy the kind of books philosophers write) is “Studies in the Way of Words”.
Grice’s maxims, provide a powerful model for human communication; the tldr:
- Maxim of quality: Try to make your contribution one that is true.
- Maxim of quantity: Make your contribution as informative as is required.
- Maxim of relation: Be relevant.
But source code is about human/computer communication, you say. Yes, but so many developers seem to behave as-if they were involved in human/human communication.
Source code rarely expresses what the developer means; source code is evidence of what the developer means.
The source code chapter of my empirical software engineering book is Gricean, with a Relevance theory accent.
More easily digestible books on Grice’s work (for me at least) are: “Relevance: Communication and Cognition” by Sperber and Wilson, and the more recent “Meaning and Relevance” by Wilson and Sperber.
Semantic vs phonetic similarity for word pairs: a weekend investigation
The Computational Semantics hackathon was one of the events I attended last weekend. Most if the suggested problems either looked like they could not reasonably be done in a weekend (it ran 10:00-17:00 on both days, I know academics hacks) or were uninspiring coding problems. Chatting to some of the academics present threw up an interesting idea that involved comparing word pair semantic and phonetic similarity (I have written about my interest in sounds-like and source code identifiers).
Team Semantic-sounds consisted of Pavel and yours truly (code and data).
The linguists I chatted to seemed to think that there would be a lot of word pairs that sounded alike and were semantically similar; I did not succeed it getting any of them to put a percentage to “a lot”. From the human communication point of view, words that both sound alike and have a similar meaning are likely to be confused with each other; should such pairs come into existence they are likely to quickly disappear, at least if the words are in common usage. Sound symbolism related issues got mentioned several times, but we did not have any data to check out the academic enthusiasm.
One of the datasets supplied by the organizers was word semantic similarity data extracted from the Google news corpus. The similarity measure is based on similarity of occurrence, e.g., the two sentences “I like licking ice-cream” and “I like eating ice-cream” suggest a degree of semantic similarity between the words licking and eating; given enough sentences containing licking and eating there are clever ways of calculating a value that can be viewed as a measure of word similarity.
The data contained 72,000+ words, giving a possible half a billion pairs (most having zero similarity). To prune this down a bit we took, for each word, the 150 other words that were most similar to it, giving around 10 million word pairs. Each word was converted to a phoneme sequence and a similarity distance calculated for each pair of phoneme sequences (which we called phonetic distance and claimed it was a measure of how similar the words sounded to each other).
The list of word pairs with high semantic/phonetic similarity was very noisy, with lots of pairs containing the same base word in plural, past tense or some other form, e.g., billion and billions. A Porter stemmer was used to remove all pairs where the words shared the same stem, reducing the list to 2.5 million pairs. Most of the noise now came from differences in British/American spelling. We removed all word pairs that contained a word that was not in the list of words that occurred in the common subset of the British and American dictionaries used by aspell; this reduced the list to half a million pairs.
The output contained some interesting pairs, including: faultless/flawless, astonishingly/astoundingly, abysmal/dismal and elusive/illusive. These look like rarely used words to me (not enough time to add in word frequency counts).
Some pairs had surprisingly low similarity, e.g., artifact/artefact (the British/American spelling equality idea has a far from perfect implementation). Is this lower than expected semantic similarity because there is a noticeable British/American usage difference? An idea for a future hack.
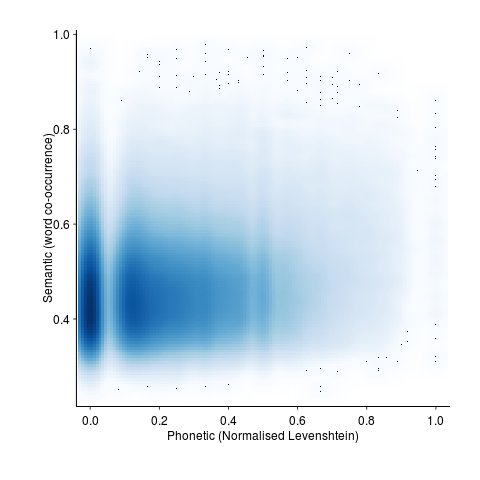
A smoothed scatter plot of semantic vs phonetic similarity (for the most filtered pair list) shows lots of semantically similar pairs that don’t sound alike, but a few that do (I suspect that most of these are noise that better stemming and spell checking will filter out). The following uses Levenshtein distance for phoneme similarity, normalised by the maximum distance for a given phoneme sequence with all phoneme differences having equal weight:
and using Jaro-Winkler distance (an alternative distance metric that is faster to calculate):
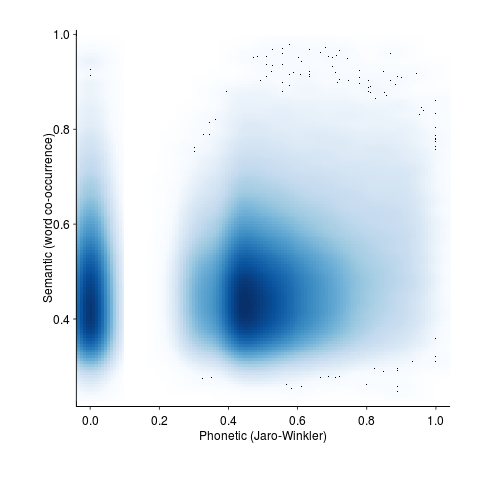
The empty band at low phonetic similarity is an artifact of the data being quantized (i.e., words contain a small number of components).
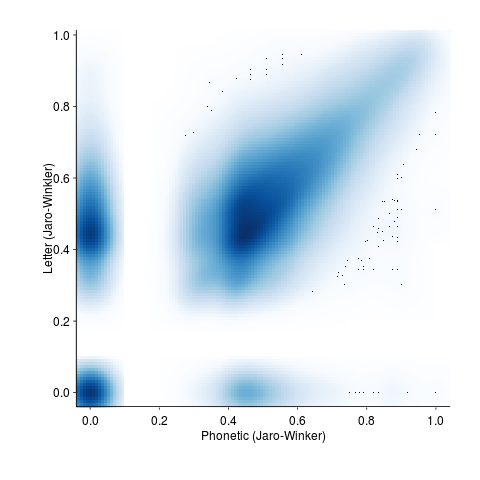
Is it worth going to the trouble of comparing phoneme sequences? Would comparing letter sequences be just as good? The following plot shows word pair letter distance vs phonetic similarity distance (there is a noticeable amount of off-diagonal data, i.e., for some pairs letter/phoneme differences are large):
Its always good to have some numbers to go with graphical data. The following is the number of pairs having a given phonetic similarity (remember the starting point was the top 150 most semantically similar pairs). The spikes are cause by the discrete nature of word components.

Squinting at the above it is possible to see an exponential decline as phonetic word similarity increases. It would be interesting to have enough data to display a meaningful 3D plot, perhaps a plane can be fitted (with a log scale on the z-axis).
Rather than using the Google news corpus data as the basis of word pair semantic similarity we could have used the synonym sets from Wordnet. This rather obvious idea did not occur to me until later Saturday and there was no time to investigate. How did the small number of people who created the Wordnet data come up with lists of synonyms? If they simply thought very hard they might have been subject to the availability bias, preferentially producing lists of synonyms that contained many words that sounded alike because those that did not sound alike were less likely to be recalled. Another interesting idea to check out at another hack.
It was an interesting hack and as often happens more new questions were raised than were answered.
Recent Comments