Archive
Halstead/McCabe: a complicated formula for LOC
My experience is that people prefer to ignore the implications of Halstead’s metric and McCabe’s complexity metric being strongly correlated (non-linearly) with lines of code (LOC). The implications being that they have been deluding themselves and perhaps wasting time/money using Halstead/McCabe when they could just as well have used LOC.
If the purpose of collecting metrics is a requirement to tick a box, then it does not really matter which metrics are collected. The Halstead/McCabe metrics have a strong brand, so why not collect them.
Don’t make the mistake of thinking that Halstead/McCabe is more than a complicated way of calculating LOC. This can be shown by replacing Halstead/McCabe by the corresponding LOC value to find that it makes little difference to the value calculated.
Some metrics include the Halstead metrics and/or the McCabe metric as part of their calculation. The Maintainability Index is a metric calculated using Halstead’s volume, McCabe’s complexity and lines of code. Its equation is (see below for details):
-0.23*McCabe-16.2*ln(LOC)")
Replacing the Halstead/McCabe terms by one involving just LOC requires an appropriate mapping. Nearly all researchers assume a linear mapping, despite the overwhelming evidence that the mapping is non-linear.
Fitting regression models for HalsteadVolume vs LOC and McCabe vs LOC, using measurements of 730K methods from 47 Java projects (see below for data details), produces the coefficients for the equation needed to map each metric to LOC (previous analysis has found that a power law provides the best mapping; code+data). Substituting these equations in the Maintainability Index equation above, we get:
)-0.23*(0.45*LOC^{0.71})-16.2*ln(LOC)")
which simplifies to:
-0.1*LOC^{0.71}")
How does the value calculated using  compare with the corresponding
  value?
For 99.7% of methods, the relative error,  , for the 730K Java methods is less than 10%, and for 98.6% of methods the relative error is less than 5% (code+data).
Given the fuzzy nature of these metrics, 10% is essentially noise.
Looking at the relative contributions made by Halstead/McCabe/LOC to the value of the Maintainability Index, second equation above, the Halstead contribution is around a third the size of the LOC contribution and the McCabe contribution is at least an order of magnitude smaller.
Background on the Maintainability Index and the measured Java projects.
The Maintainability Index was introduced in the 1994 paper “Construction and Testing of Polynomials Predicting Software Maintainability” by Oman, and Hagemeister (270 citations; no online pdf), a 1992 paper by the same authors is often incorrectly cited (426 citations). The earlier 1992 paper identified 92 known maintainability attributes, along with 60 metrics for “… gauging software maintainability …” (extracted from 35 published papers).
This Maintainability Index equation was chosen from “Approximately 50 regression models were constructed and tested in our attempts to identify simple models that could be calculated from existing tools and still be generic enough to be applied to a wide range of software.” The data fitted came from eight suites of programs (average LOC 3,568 per suite), along “… with subjective engineering assessments of the quality and maintainability of each set of code.”
Yes, choosing from 50 regression models looks like overfitting, and by today’s standards 28.5K LOC is a tiny amount of source.
The data used is distributed with the paper Revisiting the Debate: Are Code Metrics Useful for Measuring Maintenance Effort? by Chowdhury, Holmes, Zaidman, and Kazman, which does a good job of outlining the many different definitions of maintenance and the inconsistent results from prediction models. However, the authors remain under the street light of project source code, i.e., they ignore the fact that many maintenance requests are driven by demand for new features.
The authors investigate the impact of normalizing Halstead/McCabe by LOC, but make the common mistake of assuming a linear relationship. They are surprised by the high correlation between post-‘normalised’ Halstead/McCabe and LOC. The correlation disappears when the appropriate non-linear normalization is used; see code+data.
A 2014 paper by Najm also maps the components of the Maintainability Index to LOC, but uses a linear mapping from the Halstead/McCabe terms to LOC, creating a equation whose behavior is noticeably different.
Halstead & McCabe metrics: The wisdom of the ancients
Study after study finds that the predictive power of both the Halstead metric and the McCabe cyclomatic complexity metric is no better than counting lines of code, for the characteristics of interest. Why do people continue to use and cite the Halstead and McCabe metrics?
My experience, talking to people, is that many believe these metrics have greater predictive power than lines of code. Sometimes I explain the situation, other times I move on.
Those who are aware of the facts often continue to use these metrics. Why do they do this?
Given the lack of alternative metrics that are more effective than lines of code, for the claimed uses of Halstead/McCabe, following the herd is the easy option (I regularly point this out to people, after explaining that Halstead/McCabe don’t do what is claimed on the tin). Tools are available to calculate the metrics; the manual effort is clicking buttons or running a command.
Why were the Halstead/McCabe metrics ‘successful’, in that they are the ones people cite/use today?
Both were formulated in the mid-1970s, when the discussion around measuring software started in earnest, so they had some first-mover advantage (within a few years they were both being suggested for use by US Military). Individuals promoted their ideas: Maurice Halstead was a senior professor, with colleagues and lots of graduate students, who advertised the metric via their publications; Thomas McCabe was working for the NSA when his famous paper was published, and went on to form a company working in the area of source code analysis.
The Halstead/McCabe metrics can both be calculated by processing the source one line at a time (just count decision points for McCabe, no need for the pretentious graph theory stuff). In the 1970s, computer memory was often measured in kilobytes, which made it difficult to implement complicated metrics that required keeping dependency information in memory.
Metrics based on the subroutine/function/procedure/method as the measured unit of source code had an implementation and usage advantage over metrics based on larger units of code.
In the 1990s, object-oriented programming, in the form of C++ and then Java, took off. The common view, by those caught up in the times, was that object-oriented software was so different from what went before that it needed its own metrics.
The 1991 paper: Towards a Metrics Suite for Object Oriented Design, by Chidamber and Kemerer, introduced the six CK metrics (as they become known; 1992 update). The nearest this paper comes to citing the Halstead/McCabe work is to say: “Some early work has recognized the shortcomings of existing metrics and the need for new metrics especially designed for OO.” The paper followed in the footsteps of the earlier work in not providing any evidence for the claims made (the update contains histograms of metric values from a C++ project and a Smalltalk project).
The 1996 paper: Evaluating the Impact of Object-Oriented Design on Software Quality, by Abreu and Melo, introduced the MOOD metrics (Metrics for Object-Oriented Design).
At the end of 2022 the total citation counts returned by Google Scholar were: McCabe 8,670, Halstead 4,900, CK 8,160, and MOOD 354.
The plot below shows the number of new citations returned by Google Scholar, each year, for the respective metrics papers (or book for Halstead; code+data):
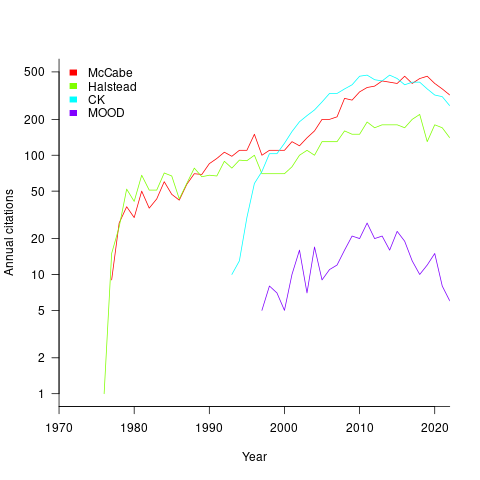
The ongoing growth in annual rate of citation probably has more to do with the growth in the number of software papers published each year, rather than these metric papers being cited by an expanding number of research fields.
Do authors tend to cite one or the other of Halstead/McCabe, or both?
Using Google Scholar’s ‘search within’ option to find the subset of papers that included a string matching the title of a paper: 46% of the Halstead citations include a citation of the McCabe paper, and 25% of the McCabe citations include a citation of the Halstead paper.
The Inciteful’s paper network (with citation counts: Halstead 1,052 and McCabe 4,970) found 657 papers citing both (62% of the Halstead total, 12% of the McCabe).
It’s not possible to make use of the OpenCitations API because it is DOI based, and the Halstead citation is a book.
The wisdom of the ancients
The software engineering ancients are people like Halstead and McCabe, along with less well known ancients (because they don’t name anything after them) such as Boehm for cost estimation, Lehman for software evolution, and Brooks because of a book; these ancients date from before 1980.
Why is the wisdom of these ancients still venerated (i.e., people treat them as being true), despite the evidence that they are very inaccurate (apart from Brooks)?
People hate a belief vacuum, they want to believe things.
The correlation between Halstead’s and McCabe’s metrics, and various software characteristics is no better than counting lines of code, but using a fancy formula feels more sophisticated and everybody else uses them, and we don’t have anything more accurate.
That last point is the killer, in many (most?) cases we don’t have any metrics that perform better than counting lines of code (other than taking the log of the number of lines of code).
Something similar happened in astronomy. Placing the Earth at the center of the solar system results in inaccurate predictions of where the planets are going to be in the sky; adding epicycles to the model helps to reduce the error. Until Newton came along with a model that produced very accurate results, people stuck with what they knew.
The continued visibility of COCOMO is a good example of how academic advertising (i.e., publishing papers) can keep an idea alive. Despite being more sophisticated, the Putnam model is not nearly as well known; Putnam formed a consulting company to promote this model, and so advertised to a different market.
Both COCOMO and Putnam have lines of code as an integral component of their models, and there is huge variability in the number of lines written by different people to implement the same functionality.
People tend not to talk about Lehman’s quantitative work on software evolution (tiny data set, and the fitted equation is very different from what is seen today). However, Lehman stated enough laws, and changed them often enough, that it’s possible to find something in there that relates to today’s view of software evolution.
Brooks’ book “The Mythical Man-Month” deals with project progress and manpower; what he says is timeless. The problem is that while lots of people seem happy to cite him, very few people seem to have read the book (which is a shame).
There is a book coming out this year that provides lots of evidence that the ancient wisdom is wrong or at best harmless, but it does not contain more accurate models to replace what currently exists 🙁
Dimensional analysis of the Halstead metrics
One of the driving forces behind the Halstead complexity metrics was physics envy; the early reports by Halstead use the terms software physics and software science.
One very simple, and effective technique used by scientists and engineers to check whether an equation makes sense, is dimensional analysis. The basic idea is that when performing an operation between two variables, their measurement units must be consistent; for instance, two lengths can be added, but a length and a time cannot be added (a length can be divided by time, returning distance traveled per unit time, i.e., velocity).
Let’s run a dimensional analysis check on the Halstead equations.
The input variables to the Halstead metrics are:  , the number of distinct operators,
  , the number of distinct operands,
  , the total number of operators, and
  , the total number of operands. These quantities can be interpreted as units of measurement in tokens.
The formula are:
- Program length:

There is a consistent interpretation of this equation: operators and operands are both kinds of tokens, and number of tokens can be interpreted as a length. - Calculated program length:

There is a consistent interpretation of this equation: the operand of a logarithm has to be dimensionless, and the convention is to treat the operand as a ratio (if no denominator is specified, the value 1 having the same dimensions as the numerator is taken, giving a dimensionless result), the value returned is dimensionless, which can be multiplied by a variable having any kind of dimension; so again two (token) lengths are being added. - Volume:

A volume has units of (i.e., it is created by multiplying three lengths). There is only one length in this equation; the equation is misnamed, it is a length.
 - Difficulty:

Here the dimensions of and cancel, leaving the dimensions of (a length); now Halstead is interpreting length as a difficulty unit (whatever that might be). - Effort:

This equation multiplies two variables, both having a length dimension; the result should be interpreted as an area. In physics work is force times distance, and power is work per unit time; the term effort is not defined.
Halstead is claiming that a single dimension, program length, contains so much unique information that it can be used as a measure of a variety of disparate quantities.
Halstead’s colleagues at Purdue were rather damming in their analysis of these metrics. Their report Software Science Revisited: A Critical Analysis of the Theory and Its Empirical Support points out the lack of any theoretical foundation for some of the equations, that the analysis of the data was weak and that a more thorough analysis suggests theory and data don’t agree.
I pointed out in an earlier post, that people use Halstead’s metrics because everybody else does. This post is unlikely to change existing herd behavior, but it gives me another page to point people at, when people ask why I laugh at their use of these metrics.
Finding the gold nugget papers in software engineering research
Academic research projects are like startups in that most fail to make any return on their investment (e.g., the tax payer does not get any money back) and a few pay for themselves and all the failures. Irrespective of whether a project succeeds or fails, those involved will publish papers on the work, give talks at conferences and workshops and general try to convince anyone who will listen that the project was a great success.
Number or papers published plays an important role in evaluating the quality of a university department and the performance on an individual researcher. As you can imagine, this publish or perish culture leads to huge amounts of clueless nonsense ending up in print. Don’t be fooled by the ‘peer reviewed’ label, most of this gets done by the least experienced people (e.g., postgrad students) as a means of gaining social recognition in their specific research community, i.e., those doing the reviewing don’t always know much.
The huge number of papers describing failed projects and/or containing clueless nonsense is a major obstacle for anyone wanting to locate useful new knowledge.
While writing my C book I refined the following approach to finding high quality papers and created filtering rules for the subjects it covered. The rules below are being applied to papers relating to my Empirical Software Engineering book. I don’t claim any usefulness for these rules outside of academic software engineering research.
I use a scatter gun approach to obtain a basic collection of papers followed by ruthless filtering.
The scatter gun approach might start with one or two papers; following links on Google Scholar or even just Google search results filtered on “filetype:pdf”, in the past I have used CiteSeer which Google now does a better job of indexing, and Semantic Scholar is now starting to be quite good.
After 30 minutes or so I have 50 pdfs (I download maybe 4,000 a year). Now I need to quickly filter the nonsense to end up with maybe 10 that I will spend 5 minutes each reading, leaving maybe 2 or 3 for detailed reading (often not the original ones I started with).
When dealing with this kind of volume you have to be ruthless.
Spend just 10 seconds on the first pass. If a paper has some merits, let it remain for the next pass. Scan the paper looking for major indicators of clueless nonsense; these are not hard to spot, don’t linger, hit the delete (if data is involved, it is worth quickly checking the footnotes for a url to a dataset, which may be new and worth collecting):
- it relies on machine learning,
- it relies on information theory,
- it relies on Halstead’s metric,
- it investigates software quality. This is a marketing term used to give a patina of relevance to the worthless metric that is likely used in the research. Be on the lookout for other high relevance terms being used to provide a positive association with a worthless metric, e.g., developer productivity defined as volume of code written
- it involves fault prediction. Academic folk psychology includes a belief that some project files contain more faults than other files, because more faults are reported in some files than others (or even that entire projects are more reliable because fewer faults have been reported). This is a case of the drunk searching under a streetlight for lost keys because that is where the ground can be seen. Faults are found by executing code, more execution means more faults. I only know of two papers that are exceptions to this rule (one of them is discussed here),
- the primary claim in the conclusion is to have done something novel. Research requires doing new stuff, novel is a key attribute that is rather pointless for its own sake. Typing code using your nose would be novel, but would you want to spend more than 10 seconds reading a paper on the subject (and this example is at the more sensible end of the spectrum of novel research I have read about).
The first pass removes around 70-80% of the papers, at least for me.
For the second pass I will spend a minute or so doing a slightly slower scan. This often cuts the papers remaining in half.
By now, I have been collecting and filtering for over 90 minutes; time to do something else, perhaps not returning for many hours.
The third pass involves trying to read the paper. The question is: Am I having trouble reading this paper because the author has managed to compress a lot of useful information into a publication page limit, or is the paper so bad I cannot see the wood for the dead trees?
Answering this question takes practice and some knowledge of the subject area. You will speed up with practice and learning about the subject.
Some things that might be thought worth paying attention to, but should be ignored:
- don’t bother looking at the names of the authors or which university they work at (who wrote the paper almost always provides no clues to its quality; there are very few exceptions to this and you will learn who they are over time),
- ignore the journal or conference that published the paper (gold nuggets appear everywhere and high impact venues only restrict the clueless nonsense to the current trendy topics and papers citing the ‘right’ people),
- ignore year of publication, quality is ageless (and sometimes fades from view because research fashions change).
If you have your own tips for finding the gold nuggets in software engineering, please let me know.
Halstead’s metrics and flat-Earthers are still with us
I recently discovered a fascinating series of technical reports from the 1970s in the Purdue University e-Pubs archive that shine a surprising light on what are now known as the Halstead metrics.
The first surprises came from Halstead’s A Software Physics Analysis of Akiyama’s Debugging Data; surprising in the size of the data set used (nine measurements of four attributes), the amount of hand waving used to pluck numbers out of thin air, the substantial difference between the counting methods used then and now and the very high correlation found between various measured and calculated attributes.
I disagreed with the numbers Halstead plucked and wrote some R to check Halstead’s results and try out my own numbers. While my numbers significantly changed the effort estimation values, the high correlations between the number of faults and various source attributes remained high. Even changing from the Pearson correlation coefficient (calculating confidence bounds for this coefficient requires that the data be normally distributed, which it is not {program size is now thought to follow a power law/exponential like distribution}) to the Spearman rank correlation coefficient did not have much impact. Halstead seems to have struck luck with this data set.
What did Halstead’s colleagues at Purdue think of these metrics? The report Software Science Revisited: A Critical Analysis of the Theory and Its Empirical Support written four years after Halstead’s flurry of papers contains a lot of background material and points out the lack of any theoretical foundation for some of the equations, that the analysis of the data was weak and that a more thorough analysis suggests theory and data don’t agree. Damming stuff.
If it is known that Halstead’s metrics do not hold up why do writers of books (including Shen, Conte and Dunsmore, the authors of the above report) continue to discuss Halstead’s work? Are they treating this work like Astronomy authors treat Ptolemy’s theory (the Sun and planets revolved around the Earth), i.e., incorrect but part of history and worth a mention?
An observation in the Shen et al report, that Halstead originally proposed the metrics as a way of measuring the complexity of algorithms not programs, explains the background to the report Impurities Found in Algorithm Implementations. Halstead uses the term “impurities” and talks about the need for “purification” in his early work. In this report Halstead points out that the value of metrics for “algorithms written by students” are very different from those for the equivalent programs published in journals and goes on to list eight classes of impurity that need to be purified (i.e., removing or rewriting clumsy, inefficient or duplicate code) in order to obtain results that agree with the theory. Now we know what needs to be done to existing programs to get them to agree with the predictions made by the Halstead metrics!
Did Halstead strike lucky with the data used in his first published analysis of ‘industrial code’, obtaining a very high correlation that caused him to shift focus away from measuring algorithms to measuring programs? Unfortunately, he died soon after publishing the work for which he is now known, so he did not get to comment on how his ideas were used over the subsequent years.
Why are people still attracted to the Halstead metrics, given their poor theoretical foundations and a predictive power that is comparable with using lines of code? Is it because the idea of code volume and length are easy to understand and so are attractive (dimensionally, both of these metrics are the same, a fact that cannot hold for any self-consistent concept of volume and length)? Is it because we don’t have alternative metrics that outperform the poorly performing ones proposed by Halstead, after all Copernicus only won out because his theory gave answers that were more accurate than Ptolomy’s.
Perhaps like the flat Earthers proponents of the Halstead metrics will always be with us.
Recent Comments