Archive
Long tail licensing
Team ‘Long Tail Licensing’ (Richard, Pavel, Gary and yours truly) took part in the Fintech startupbootcamp hackathon at the weekend.
As the team name suggests the plan was to implement a system of payment and licensing for products in the long tail, i.e., a large number of low value products. Paypal is good for long tail payment but does not provide a way for third parties to verify that a transaction has occurred (in fact Paypal does its best to keep transactions secret from everybody except those directly involved).
Our example use case was licensing of individual Github repositories. Most of today’s 3.4 million developers with accounts on Github would rather add more features to their code than try to sell it; the 16.7 million repositories definitely qualifies as a long tail of low value products (i.e., under £100). Yes, Paypal could be (and is) used as a method of obtaining payment, but there is no friction-free method for handling licensing (e.g., providing proof of licensing to third parties).
Long Tail Licensing’s implementation used cryptocurrency for both payment and proof of licensing (by storing license information in the blockchain). For the hackathon we set up out own private Bitcoin blockchain to act as a test rig, supply fast mining and provide near instantaneous response.
To use Long Term Licensing a developer creates the file .cryptolicense in the top level directory of their repo; this file contain information on the amount to pay, cryptocurrency account details and text of licensing terms. A link in the README.md file points at our server, which validates the .cryptocurrency file and sets up a payment transaction from the licensee’s Bitcoin wallet; the licensee confirms the transaction and the payment is made.
The developer’s chosen license information is included in the transactions blockchain, providing the paperwork that third-parties can view to verify what has been licensed. This licensing information could be in plain text or use public key encryption to restrict who can read it (e.g., eBay could publish a public key that third parties could encrypt information so that only eBay’s compliance department could read it).
The implementation code includes links to private servers and other stuff that it should not be be; hackathon code is rarely written with security in mind. So those involved would rather it not be pushed to Github (perhaps it will get tidied up and made suitable for public consumption at a later date).
We did not win any of the prizes :-(. Well done to Manoj (a frequent hackathon collaborator) and his team for winning the $100k of Google cloud time prize.
Top secret free information
I may or may not have been at a top secret hackathon at the weekend.
If you read the above text please leave your contact details in the comments so I can arrange to have somebody come round and shoot you.
In other news, I saw last week that the European Delegated Act requires that the European Space Agency to provide “Free and open access to Sentinel satellite data…” A requirement that is not incompatible with the wording above.
Empirical analysis of UK legislation started this weekend
Yesterday I was one of a dozen or so people at a hackathon hosted by the Ministry of Justice. I’m sure that the organizers would have liked a lot more people attending, but the McDonald’s hackathon across town was a bigger draw for most of the hackers I know.
The dataset was all UK legislation back to 1988, and a less complete set going back to 1267, in html and various flavors of xml; in all 20G of compressed files, with the compressed html files occupying 7G on my machine. As of this weekend the files are available online.
There were about half a dozen domain experts, in various aspects of the creation of UK legislation, present and they suggested lots of interesting questions that we (i.e., the attendees who could code) might like to try to answer.
I was surprised at the simplicity of some questions, e.g., volume (e.g., word count) of legislation over time and branch of government. The reason these question had not been answered before is that the data had not been available; empirical analysis of UK legislation started this weekend.
The most interesting question I heard involved the relative volume of primary and secondary legislation. Primary legislation is written by Parliament and in some cases creates a framework that is used by secondary legislation which contains the actual details. A lot of this secondary legislation is written by the Executive branch of government (by civil servants in the appropriate branch of government) and may not involve any parliamentary oversight. Comparing the relative volume of primary/secondary legislation over time would show if the Executive branch was gaining more powers to write laws, at the expense of Parliament.
With all the interesting discussions going on, setting ourselves up and copying the data (from memory sticks, not the internet), coding did not really start until 11, and we had to have our projects ‘handed-in’ by 16:00, not enough time to be sure of getting even an approximate answer to the primary/secondary legislation question. So I plumped for solving a simpler problem that I was confident of completing.
Certain phrases are known to be frequently used in legislation, e.g., “for the purposes of”. What phrases are actually very common in practice? The domain experts were interested in phrases by branch of government and other subsets; I decided to keep it simple by processing every file and giving them the data.
Counting sequences of n words is a very well studied problem and it was straightforward to locate a program to do it for me. I used the Lynx web browser to strip out the html (the importance of making raw text available for this kind of analysis work was recognized and this will be available at some future date). I decided that counting all four word sequences ought to be doable on my laptop and did manage to get it all to work in the available time. Code and list of 4-grams over the whole corpus available on Github.
As always, as soon as they saw the results, the domain experts immediately starting asking new questions.
Regular readers of this blog will know of my long standing involvement in the structure and interpretation of programming language standards. It was interesting to hear those involved in the writing/interpretation of legislation having exactly the same issues, and coming up with very similar solutions, as those of us in the language standards world. I was surprised to hear that UK legislation has switched from using “shall” to using “must” to express requirements (one of the hacks plotted the use of shall/must over time and there has been an abrupt change of usage). One of the reasons given was that “must” is more modern; no idea how word modernness was measured. In the ISO standards’ world “shall” is mandated over “must”. Everybody was very busy in the short amount of time available, so I had to leave an insiders chat about shall/must to another time.
The availability of such a large amount of structured English documents having great import should result in some interesting findings and tools being produced.
Predicting stuff involving the next hour of my life
Rain-on-me is an idea for an App that I have had for a while and have been trying to get people interested in it at Hackathons I attend. At the Techcrunch hackathon last weekend my pitch convinced Rob Finean, who I worked with at the Climate change hack, and we ended up winning in the Intel Mashery category (we used the wunderground API to get our realtime data).
The Rain-on-me idea is to use realtime rain data to predict how much rain will occur at my current location over the next hour or so (we divided the hour up into five minute intervals). This country, and others, has weather enthusiasts who operate their own weather stations and the data from these stations has been aggregated by the Weather Underground and made available on the Internet. Real-time data from local weather stations upwind of me could be used to predict what rain I am going to experience in the near future.
Anybody who has looked at weather station data, amateur or otherwise, knows that measured wind direction/speed can be surprisingly variable and that sometimes sensor stop reporting. But this is a hack, so lets be optimistic; station reporting intervals seem to be around 30 minutes, with some reporting every 15 mins and others once an hour, which is theory is good enough for our needs.
What really caught peoples’ attention was the simplicity of the user interface (try it and/or download code):
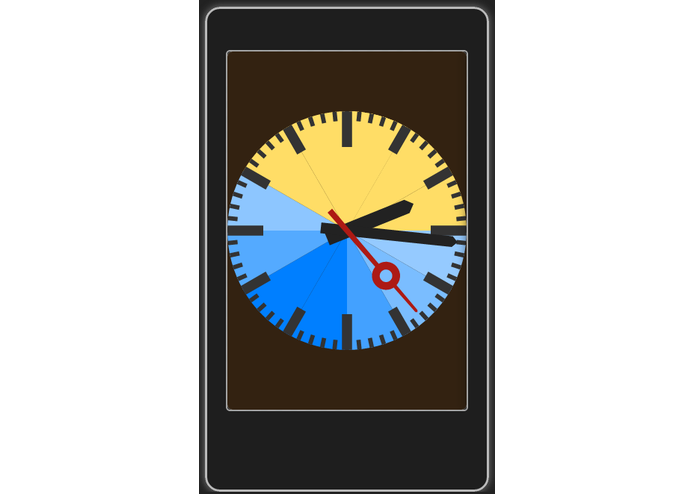
Being techies we were working on a design that showed quantity of rain and probability of occurring (this was early on and I had grand plans for modeling data from multiple stations). Rob had a circular plot design and Manoj (team member on previous hacks who has been bitten by the Raspberry pi bug) suggested designing it to run on a smart watch; my only contribution to the design was the use of five minute intervals.
The simplicity of the data presentation allows viewers to rapidly obtain a general idea of the rain situation in their location over the next hour (the hour is measured from the location of the minute hand; the shades of blue denote some combination of quantity of rain and probability of occurring).
This is the first App I’ve seen that actually makes sense on a smart watch. In fact if the watches communicated rain status at their current location then general accuracy over the next hour could become remarkably good.
Rainfall is only one of the things in my life that I would like predicted for the next hour. I want British rail to send me the predicted arrival time of the train I am on my way to catch (I may not need to rush so much if it is a few minutes late), when is the best time, in the next hour, to turn up at my barber for a hair cut (I want minimum waiting time after I arrive), average number of bikes for hire at my local docking station (should I leave now or is it safe to stay where I am a bit longer), etc.
Predicting events in the next hour of people’s lives is the future of Apps!
The existing rain-on-me implementation is very primitive; it uses the one weather station having the shortest perpendicular distance from the line going through the current location coming from the current wind direction (actually the App uses an hour of Saturday’s data since it was not raining on the Sunday lunchtime when we presented). There is plenty of room for improving the prediction reliability.
Other UK weather data sources include the UK Metoffice which supplies rainfall radar and rainfall predictions at hourly intervals for the next five days (presumably driven from the fancy whole Earth weather modeling they do); they also have an API for accessing hourly data from the 150 sites they operate.
The Weather Underground API is not particularly usable for this kind of problem. The call to obtain a list of stations close to a given latitude/longitude gives the distance (in miles and kilometers, isn’t there a formula to convert one to the other) of those station from what looks like the closest large town, so a separate call is needed for each station id to get their actual location!!! Rather late in the day I found out that the UK Metoffice has hidden away (or at least not obviously linked to) the Weather Observations Website which appears to be making available data from amateur weather stations.
Creating a map showing land covered by rising sea levels
I joined the Geekli.st climate Hackathon this weekend at the Hub Westminster (my favorite venue for Hackathons). While the organizers had lots of enthusiasm they had very little in the way of data for us to work on. No problem, ever since the Flood-relief hackathon I have wanted to use the SRTM ‘whole Earth’ elevation data on a flood related hack. Since this was a climate change related hack the obvious thing to do was to use the data to map the impact of any increases in sea level (try it, with wording for stronger believers).
The hacking officially started Friday evening at 19:00, but I only attended the evening event to meet people and form a team. Rob Finean was interested in the idea of mapping the effects of sea a rise in level (he also had previous experience using leaflet, a JavaScript library for interactive maps) and we formed a team, Florian Rathgeber joined us on Saturday morning.
I downloaded all the data for Eurasia (5.6G) when I got home Friday night and arriving back at the hackthon on Saturday morning started by writing a C program to convert the 5,876 files, each 1-degree by 1-degree squares on the surface of the Earth, to csv files.
The next step was to fit a mesh to the data and then locate constant altitude contours, at 0.5m and 1.5m above current sea level. Fitting a 2-D mesh to the data was easy (I wanted to use least squares rather than splines so that errors in the measurements could be taken into account), as was plotting and drawing contours, but getting the actual values for the contour lat/long proved to be elusive. I got bogged down looking at Python code, Florian knew a lot more Python than me and started looking for a Python solution while I investigated what R had to offer. Given the volume of data a Python solution looked like the best fit for the work-flow.
By late afternoon no real progress had been made and things were not looking good. Google searches on the obvious keywords returned lots of links to contour plotting libraries and papers claiming to have found a better contour evaluation algorithm, but no standalone libraries. I was reduced to downloading the source code of R to search for the code it used to calculate contours, with a view to extracting the code for my own use.
Rob wanted us to produce kml (Keyhole Markup Language) that his front end could read to render an overlay on a map.
At almost the same time Florian found that GDAL (Geospatial Data Abstraction Library) could convert hgt files (the raw SRTM file format) to kml and I discovered the R contourLines function. Florian had worked with GDAl before but having just completed his PhD had to leave to finish a paper he was working on, leaving us with instruction on the required options.
The kml output by GDAL was great for displaying contours, but did not fill in the enclosed area. The output I was generating using R filled the area enclosed by the contours but contained lots of noise because independent contours were treated having a connection to each other. I knew a script could be written to produce the desired output from the raw data, but did not know if GDAL had options to do what we wanted.
Its all very well being able to write a script to produce the desired output, but what is the desired output? Rob was able to figure out how the contour fill data had to be formatted in the kml file and I generated this using R, awk, sed, shell scripts and around six hours of cpu time on my laptop.
Rob’s front end uses leaflet with mapping data from Openstreetmap and the kml files to create a fantastic looking user-configurable map showing the effect of 0.5m and 1.5 rises in sea level.
The sea level data on the displayed map only shows the south of England and some of the north coast of Europe because loading any more results in poor performance (it is all loaded statically). Support is needed for dynamically loading of data on an as required basis. All of the kml files for Eurasia with 1.5 sea level rise are up on Github (900M+ of data). At the moment the contour data is only at the most detailed level of resolution and less detailed resolution is needed for when users zoom out. R’s contourLines function has no arguments for changing the resolution of which it returns; if you know of a better contour library please let me know.
The maps show average sea level. When tides are taken into account the sea level at certain times of the day may be a lot higher in some areas. We did not have access to tide data and would not have had time to make use of it anyway, so the effects of tide on sea level are not included.
Some of the speckling in the overlays may be noise caused by the error bounds of the SRTM data (around 6m for Eurasia; an accuracy level that makes our expectation of a difference between 0.5m and 1.5m contours problematic).
My first day developing for Google Glass
I was at the Google Glass Design Sprint & Workshop in London today. I don’t own a Google Glass and applied for one of the limited spaces available to developers who would be lent hardware for the day. Any idea I was harboring of Google recognizing me as an ace hackathon attendee were dashed at the start when we were told that the available slots had been filled by a random draw of applicants.
Vendor presentations at the start of hackathons tend to be either deadly dull or eye opening. Timothy Jordan explained why software written for Google Glass were not Apps, or rather should not be written with this mindset, but needed to be thought of in terms of enhancing the user’s experience in real time the moment; this really clicked with me. He also made some excellent points on user interface issues specific to the glass form factor which I think went over the head of most people present (this really needed its own slot).
I turned up with an App user enhancement experience reasonably well formed in my mind. The idea was to port the numbers tool to Android and have it scan the incoming camera image for numbers, information about the interesting ones being spoken into the users ear (e.g., that number of there is the rest mass of the electron).
On the day Google handled out a half a dozen brief biographies of potential Glass users and asked us to come up with ideas for software to enhance the lives of these people. I came up with the idea for helping the triathlete on the cycling leg of his competition. Having watched highlights from the Tour de France I knew that corners on the downhill stages of mountain routes presented a significant problem to riders traveling at up to 65 mph, i.e., how hard should they break to get safely around a corner whose curvature they could not see. My idea was for the corner curvature user experience to come to life when the riders speed exceeded, say, 45 mph and displayed a simple colored wiggly line that represented what lies around the bend.
Listening to other people at my table and in other groups I was surprised at how many were designing their idea as an App; that is, they wanted user to select from drop down menus and/or specify various numeric/literal values. My pointing out that they were designing Apps was met with blank stares.
Progress on writing actual code was hampered by lunch, having to leave at 17:30 and adb not working out of the box under Windows (this prevented any communication between the Android SDK running on Windows and Google glass). It took a while to figure out that the problem was adb/Windows (the Google folk had no idea it did not work since they all used Linux or Apple Macs). As usual an answer on Stackoverflow explained what changes needed to be made to the Google software. Asking around uncovered a few people with horror stories to tell about getting adb communication under Windows.
Microsoft Windows has significantly slipped in developer tool mind share over the last few years (I am even thinking of buying my first Mac next time I change my laptop). However, there are still a lot of Windows developers out there and Google will need to fix this problem if they want to attract lots and lots of developers.
But the biggest mistake Google need to fix is to make sure they don’t ever again run out of coffee mid-afternoon at an all day hackathon.
MyFloodPlan: The personalized flood plan App
I took part in the HackTheTownHall flood-relief hackathon at the weekend. Team MyFloodPlan (me, Manoj, Lusine, Anthony and Sanjeet) built an App (try it) that created personalised flood plans; tell us where you live and we tell you number of hours before the flood water reaches you, plus providing a list of recommended actions for that time frame, with the timing of the recommended actions being influenced by personal circumstances such as age (older people likely to take longer to do things than younger people), medical situation and risk aversion. The App has five prespecified users at various locations in the worst hit flooding areas around west London in February 2014. UK Government recommendations are basically to move things to higher ground (e.g., upstairs) and just as the water arrives at your door turn off the gas and electric.
The App used the Ordnance Survey Terrain 50 data (height above sea level of 50 meter squares covering the whole UK and accurate to 0.01 0.1 meters) to find the difference in height between the user’s location and the last reported local flood height (we faked this number), multiplied this by how fast the flood water is rising (we picked 100 10 cm per hour) to find out how many minutes it would take for the flood to reach the user’s location. In practice it would be easy to get the current flood height, the user could simply walk to the current edge of the flood and tell the App where it was; data on rate of height increase/decrease could come from the Environment agency flood warning site.
The Ordnance survey has height data at 5 meter square resolution and supplied a sample for an area near Bristol. The accuracy of GPS is nowhere near good enough for obtaining height data. Altitude data for most of the world is available thanks to the Shuttle Radar Topography Mission; the grid resolution is 30 meters in the US and 90 meters outside the US.
I thought of creating a 2-D equation that interpolated between all known points (using say, cubic splines), this would smooth out height discontinuities and probably improve the estimates for most locations. But given the large unknowns in rate of change of flood water height, interpolation seemed like over-kill (given how smooth the data is over much of the UK this approach might be away of reducing data storage/access).
The big unknown in all of this is modeling changes in flood water level. In February there were announcements that gave maximum levels. The ideal situation is for the Environment agency to provide a predicted flood water level time line API. They probably have the predictions, but given the degree of uncertainties present in all models I would understand any reluctance in making this information available in real time.
On the ground monitoring the progress of a flood would only take a few people on bikes to cover a whole town, reporting back to a local system that kept everybody updated. Real-time flood level tracking is not a big data problem (prediction and maintaining historical data are) and a handful of people using modest computer resources could easily provide a personalized flood warning service to locals.
Team MyFloodPlan was made up of Team prompt Parking (minus Bob), from a previous hackathon, plus two other people, and these provided a useful reminder of the mindset needed for a hackathon. Producing a working App in 24 hours requires keeping things simple and doing what needs to be done; sometimes outrageous simplifications have to be made and the most awful coding solutions have to be lived with. Our two new members (a business consultant and very clever technical guy) were into considering all the issues and how they connected, and looking to keep all potential customers happy; all good stuff to do when there is plenty of time and resources available, but fatal mistakes in a short hackathon. We spent all day going in circles around the original idea (team Prompt Parking are very laid back and prone to gossiping about tech with anybody who happens to wonder by), when the two left for the night the circling died down and within a few hours we had the basic core of the App coded and working.
The oversimplifications made by team PromptParking, along with our willingness to ignore ‘low volume’ customers left our two newbies exasperated and baffled. However, the aim is to produce the best minimum viable product, not an impressive report covering all the issues
How can flood data be monetized using an App? Floods are too rare for the MyFloodPlan App to provide a regular income. Perhaps during a flood it could cheer people up by displaying adds for holidays in sunny destinations, provide suggestions for new furniture, decorating ideas, etc and if the flood had not yet reached them the best place to sell their home.
The best money making App I could think of was one that provides flooding information to potential home buyers. The DoesThisLocationFlood App would show pictures of previous floods in the area (picture gathering would be so much easier if Twitter did not remove location information from posted pictures), along with height above local water features and distance from them. It would be great to tie in with online home purchase sites, but these make money from the seller and so are unlikely to see any added value in the DoesThisLocationFlood App.
The MyFloodPlan App came second, beaten by an App that allowed users to report and see events in a flood affected area (and made great use of text messaging). Our App was not very interactive, i.e., flood arrives in x hours, do these things. We should have been more adventurous; having been gone down the route planning rabbit hole before I shied away from figuring out which road were flooded and suggesting alternative routes (the route planners in OpenStreetMap do seem to be improving).
Thanks to Milverton for organizing the event and the knowledgeable and helpful people from the Environment agency and Ordnance survey.
A request for future events: A method of turning off the lights so people don’t have to sleep under the tables to stop the motion detectors turning the lights on.
The Shattered Windows App: How much will an asteroid impact cost you?
I was at the Space Apps Challenge in London yesterday. I was part of a group of people interested in the Asteroid challenges with my subgroup (i.e., me) trying to estimate the financial consequences of an impact of a given size at a given location. These open ended hackathons involve a lot of upfront data collection, which for this problem required engineering/physics knowledge and my fellow asteroid enthusiasts included an undergraduate and four web developers (finding one good one is usually hard and here I was surrounded by them).
I worked out a plan for calculating the financial consequences of an asteroid impact and found out lots of useful stuff, but did not get to write any code. So this is a paper implementation.
The Shattered Windows App deals with the impact of asteroids of the kind recently experienced by the Russians in Chelyabinsk Oblast. Most of the existing published work concentrates on the much larger global impact events, which are great for dramatic TV programs and films but make for a boring App (global catastrophes wiping out whole countries have limited scope for localizations that allow users to understand the consequences in their community).
Recently declassified military satellite data and data from the Infrasound network has shown that asteroid impacts generating kiloton airbursts are surprisingly common ( impacts per annum, where
  is energy in kilotons; a megaton event around every 15 years or so).
The energy from an airburst (explosion in the air) generates a shock wave that travels through the atmosphere. The overpressure from this shock wave, if large enough, will smash things, including windows, roofs (the Chelyabinsk event took out a few of these) and complete buildings; people are remarkably resistant to overpressure. I decided to concentrate on windows since these are the most likely to be smashed and flying glass is a huge health hazard.
The Bishopsgate bombing is a good illustration of the impact of a blast on windows, in this case just over 1 ton of equivalent TNT breaking 500 tonnes of glass (£1.4 billion of damage in 2014 money).
The sequence of calculations needed to generate the information that can be fed into a web front end displaying a map of financial cost contours for an event at a given location include:
- Calculate likely asteroid mass and velocity. Asterank presents a stunning amount of information on known asteroids and all the code is available on github.
- Calculate the size of the airburst, in kilotons, generated by the impact of an asteroid having a given mass, velocity and angle of atmosphere entry. The paper Earth Impact Effects Program: A Web-based computer program for calculating the regional environmental consequences of a meteoroid impact on Earth follows the herd in discussing huge global events but contains the needed equations (ignore the stuff about crater size and seismic events).
- Calculate the overpressure at a given distance from the atmospheric airburst. The book The Effects of Nuclear Weapons contains the necessary charts and methods (starting around page 113). The Nuclear Weapons Frequently Asked Questions is also worth reading.
- Calculate the number of windows/area of glass present at a given distance from the airburst. My thinking here is population density data from the last census to estimate the number of dwellings in a given area and housing window data from the English Housing Survey (69% of dwellings have PVC-U double glazed units) to estimate window/glass totals per dwelling. I am currently assuming that commercial windows can be handled by multiplying the residential totals by some small value (this won’t work for large city centers like London). Pointers to commercial building window data welcome.
- Calculate value of smashed windows/glass. Previously cited sources give rough figures for the range of overpressures needed to break windows; more accurate information on overpressure needed to smash particular kinds of windows would be useful. A rough calculation can be made by combining all the above calculated information.
All that is needed now is a fancy web front end that allows users to select a known asteroid, select a location (the location reported by a phone’s gps being the default) and display an easy to digest damage map.
Data for other countries, e.g., the US, could also be added.
Thanks to the hosts who kept us well fed and watered. A note for future events: bigger tables would be good and comfier chairs for those not yet experienced enough to have developed the ninja skills needed to hack sitting for long period on hard plastic chairs.
Update: The folks at B612 have paper plans for a more upmarket App in mind; they want to nudge the asteroid so it misses the Earth. I wonder if they will sell ads on the side of the rocket?
Prompt Parking near Buckingham Palace
I was at the Urban Data Hack at the weekend run by Data Science London (doing their usual excellent job of feeding and watering us). Team Prompt Parking (me, Manoj, Lusine and Bob {of team Outlier fame}) created an App (try it) that gives drivers directions to the closest locations, in Westminster, most likely to have an empty parking space, taking into account preferences for space actually being available, distance to drive and probability of experiencing vehicle/personal crime close to the parking bay.
The default starting location is the official London residence of the Queen, which is in Westminster (most of the data came from Westminster City Council), and can be changed by entering latitude/longitude at the top of the page; in practice it would use the current location reported by the phone gps.
How does the App work? Based on your current location, day of week and time of day, it obtains data on ‘close’ parking bays (precomputed data; see below), applies the user preferences to the bay data to obtained a weighted preference for each bay, picks the four bay locations with the highest weight and feeds these locations into Google maps to draw the route.
The precomputed data included (code and data):
- mean number of empty parking spaces within every 15 minute window of a given day of the week (the week was assumed to be the only parking related cycle). The parking dataset included every parking transaction in Westminster between April 2013 to January 2014; the 861 megabyte file containing 6,967,793 transactions was boiled down to 49M using
awkto split the data up, one file per parking location, making it practical to run anRscript on each file to do the averaging (we also calculated a standard deviation which never got integrated into the weighting), - likelihood of crime against vehicles and people. The crime data included a lat/long and the ‘influence’ of each recorded crime (i.e., the likelihood of another crime being committed nearby) was assumed to have a gaussian distribution having a mean of 200 meters (chosen by a couple of white guys staring at the ceiling). The crime data was monthly and sparse (good for citizens but bad for data analysis) and ended up being amalgamated to an overall number per parking location per year (i.e., the gaussians for each crime ‘influence’ were summed over the area of Westminster),
- the distance, along streets (not flying crows), to every parking bay was calculated from 50 ‘red spots’ (these spots were chosen to be well distributed over major routes within Westminster). The App takes the user’s location and calculates the closest red spot to use for parking bay distance information.
- the data included parking cost information but we did not get around to including that in the App
The hack had prizes for various categories. Team Prompt Parking received 1st Prize for Urban Data Integration, which surprised me as I thought we were the best in some of the other categories. My heart sank when I saw the Team DeTile App (the team’s Italian accent may have thrown my spelling) which combined crime data with a property company’s API to produce a flat (apartment in the US) finder recommender running on a phone; they deserved to win the Best App category.
Team Prompt Parking did not consider how money might be made from the App; our submission report included crowd pleasing concepts such as reducing CO2 emissions and accident rates by reducing driving time to find an empty parking space. Having drivers look at ads displayed in the App would probably increase accidents.
A more promising money making App, using this data, would target traffic wardens; the data shows a higher empty bay rate than that experienced by the central London drivers I spoke to at the weekend (some obvious human biases spring to mind here). There is an opportunity here for a startup to offer traffic wardens routes tailored to maximize the number of parking tickets per hour; the company would take a percentage of the warden’s earnings.
The main lesson learned was not to create large databases in the cloud during a short hack. While one database containing all the data is a good idea in theory, in a 24 hour hackathon there is not a lot of time to iterate when database creation goes wrong (which everybodies did, several times). It is better to do as much as possible on local laptops (I split the 860M data file into smaller chunks using a local awk script rather than load it into a cloudy sql database that I then had to access remotely).
We had a separate database for each dataset, making it quick to iterate changes to each dataset and not creating dependencies that held up testing using the other datasets.
Apps in Space Hackathon
I went along to the Satellite Applications hackathon last weekend. As a teenager I was very much into space flight and with this event being only 30 miles away how could I not attend. Around 25 or so hackers turned up, supported by seven or so knowledgeable and motivated people from the organizers/sponsors. Excellent food+drink, including sending out for Indian/Chinese for dinner. The one important item in short supply was example data to experiment with; the organizers are aware of this and plan to have a lot more data available at the next event.
The rationale for the event is to encourage the creation of business activities in the UK around the increasing amount of data beamed to Earth from satellites. At the moment a satellite image costs something like £100 if its in the back catalog and £10,000 if you want them to take one just for you; the price of images in the back catalog is about to plummet (new satellites coming on stream) and a company is being set up to act as a one stop shop+good user interface for pics (at the moment customers have to talk to a variety of suppliers to find see what’s available). I was excited to hear that I could have my own satellite launched for £100,000, the catch being that they are a bit more expensive to build.
Making use of satellite data requires other data plus support software. Many of the projects people decided to work on needed access to mapping data, e.g., which road is closest to this latitude/longitude. Open Streetmap is the obvious source of mapping data, the UK’s Ordinance Survey have also made some data freely available for public/commercial use. The current problem with this data is the lack of support libraries designed to handle satellite related queries (e.g., return nearest road, town, etc), the existing APIs are good for creating mapping images and dealing with routing.
Support for very large images is one area where existing tools are going to need an upgrade; by very large I mean single image files measured in gigabytes. I did not manage to view any gigabyte image files on my laptop (with 4G of ram), even after going for a coffee and sitting talking to somebody waiting for it to cool before drinking it, still a black rectangle. If the price of satellite images plummets and are easy to buy online, then I can imagine them becoming a discretionary item that people buy for a bit of fun and will then want to view using the devices they already own; telling them that this is not sensible is the wrong answer, the customer is always right and it has to be made to work.
One area where there is good software tool support is working out where satellites will appear in the sky; this is really an astronomical application and there are lots of astronomical tools out there. The Python crowd will be happy to know that scientific-grade astronomy routines are available in Pyephem.
For the most part the hacks created are bullet points of ideas and things to do. The team working on calculating the satellite beam likely to have the strongest signal at a given point on the Earth’s surface made a lot more progress than anybody else. This is because they had an existing Python library to use and ‘only’ needed to apply the trigonometry that we all learn in school.
Some suggestions for the organizers:
- put lightening talks on existing technologies and some of their uses on the agenda (the brief presentation given on SAR was eye opening),
- make some good example data public, i.e., downloadable for all to use. This is the only way to get lots of library support written,
- create cut-down datasets that are usable on laptops. At a Hackathon people can only productively use what they know well and requiring them to use something unfamiliar, such as a virtual machine, is a major road block,
- allow external users to take part, why limit your potential customer base to what can be fitted into a medium size room?
Recent Comments