Archive
Adding house numbers to Open Street Map
Team OSM-house-numbers (Pavel and yours truly) was at the Open Street Map London hack weekend a few days ago.
When Phyllis Pearsall was out walking the streets of London in the 1930s gathering information for her Geographer’s A-Z London street map she recorded house numbers and included this information on her maps. House number information is included in OSM data when people have added it. Is there a way of automatically adding this information in bulk?
The UK Land Registry maintains a database of house sales; the information includes postcode, street and house number. The database is available under the Open Government License, which is compatible with the OSM license.
It is straight-forward to match all house sales having the same postcode/street to obtain a min/max house number for a postcode/street.
The first half of a UK postcode specifies a large area or district (e.g., GU14 is my district code), while the second half has a granularity of around a quarter of a mile or less (depending on housing density).
It was decided that house numbers on a map become useful when streets are long enough, where long enough is defined as containing houses having different postcodes. Assuming that street names are unique within a given postcode district, filtering out not-long enough streets was trivial.
The Land registry started recording sales in 1995 and it is possible that some streets are not considered to be long enough because they contain houses that have not been sold within the last 20 years; this problem will also affect the min/max value of some house number ranges.
To tie this postcode/street information to Open Street Map data we need latitude/longitude information.
Information on house number locations is very useful to governments and in the UK is collected by our national mapping body, the Ordinance Survey, who like all UK government bodies have a long history of being loath to make information available for general public use. The current situation, according to Wikipedia, is that the Ordinance Survey mapping from postcode to latitude/longitude is available as open data.
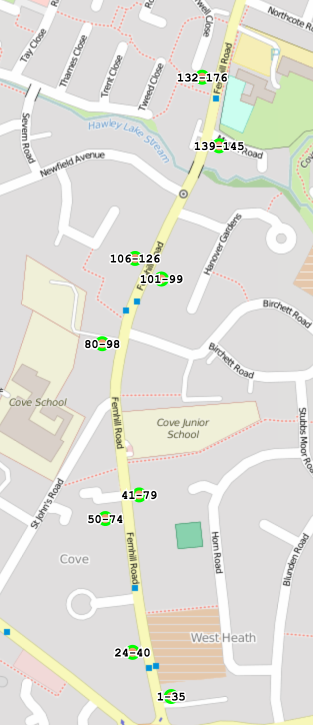
Adding information for postcode lat/long and feeding everything into a webpage produces a map such as the one below (opposite sides of the street having different postcodes is plainly visible):
We cannot guarantee that the house number data we have created is 100% accurate; there may be mistakes in our code or the Land registry/Ordinance Survey data we processed. Experienced OSM hackers at the event told us about minor mistakes in automatically generated data, that had occurred in the past and had a disproportionate impact on user confidence in OSM accuracy. So we did not upload our data to OSM; you can find it on github (saved in compressed form to reduce download time), along with the code used to create it.
The hackathon finished at five, with people decamping to a local pub. We were more or less done by three. What next (perhaps for another hackathon or a dedicated OSM hacker)?
What is needed is a simple way to overlay house number range information on an OSM image which can be easily used by people with local knowledge to confirm whether it is correct or not, with the data being added to OSM if it is correct.
Other possible OSM uses for the Land registry data include estimating density of houses along a street, e.g., number-of-unique-house-numbers divided by distance-between-adjacent-postcodes and perhaps even a house price heatmap (ok, that’s a bit specialized).
What about trees? This is my tree hugging side showing itself. If you plan to go out mapping house numbers, don’t forget to map the trees!
A first stab a low resolution image enhancement
Team Clarify-the-Heat (Gary, Pavel and yours truly) were at a hackathon sponsored by Flir at the weekend.
The FlirONE contains an infrared sensor with 160 by 120 pixels, plus an optical sensor that provides a higher resolution image that can be overlaid with the thermal, that attaches to the USB port of an Android phone or iPhone. The sensor frequency range is 8 to 14 µm, i.e., ‘real’ infrared, not the side-band sliver obtained by removing the filter from visual light sensors.
At 160 by 120 the IR sensor resolution is relatively low, compared to today’s optical sensors, and team Clarify-the-Heat decided to create an iPhone App that merged multiple images to create a higher resolution image (subpixel interpolation) in real-time. An iPhone was used because the Flir software for this platform has been around longer (Android support is on its first release) and image processing requires lots of cpu power (i.e., compiled Objective-C is likely to be a lot faster than interpreted Java). The FlirONE frame rate is 8.6 images per second.
Modern smart phones contain 3-axis gyroscopes and data on change of rotational orientation was used to find the pixels from two images that corresponded to the same area of the viewed 2-D image. Phone gyroscope sensors drift over periods of a few seconds, some experimentation found that over a period of a few seconds the drift on Gary’s iPhone was safely under a tenth of a degree; one infrared pixel had a field of view of approximately 1/3 degrees horizontally and 1/4 degrees vertically. Some phone gyroscope sensors are known to be sensitive enough to pick up the vibrations caused by local conversations.
The plan was to get an App running in realtime on the iPhone. In practice debugging a couple of problems ate up the hours and the system demonstrated uploaded data from the iPhone to a server which a laptop read and processed two images to create a higher resolution result (the intensity from the overlapping pixels is averaged to double, in our case, the resolution). This approach is very primitive compared to the algorithms that do sub-pixel enhancement by detecting image features (late in the day we found out that OpenCV supports some of this kind of stuff), but it requires image less image processing and should be practical in real-time on a phone.
We discovered that the ‘raw’ data returned by the FlirONE API has been upsampled to produce a 320 by 240 image. This means that the gyroscope data, used to align image pixels, has to be twice as accurate. We did not try to use magnetic field data (while not accurate the values do not drift) to filter the gyroscope readings.
Two IR images from a FlirOne, of yours truly, and a ‘higher’ resolution image below:
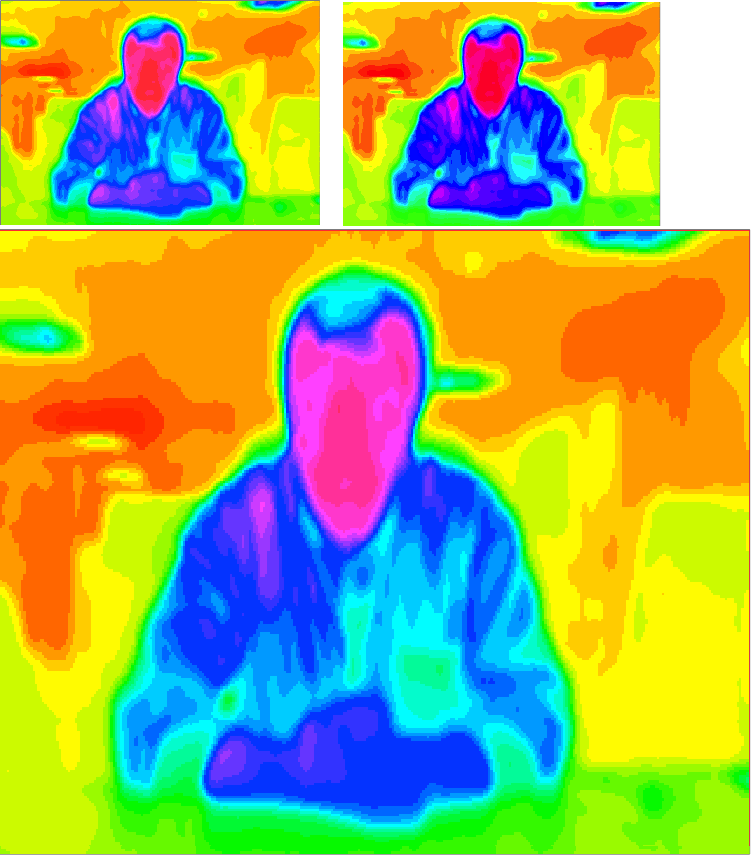
The enhanced image shows more detail in places, but would obviously benefit from input from more images. The technique relies on partial overlap between pixels, which is a hit and miss affair (we were managing to extract around 5 images per second but did not get as far as merging more than two images at a time).
Team Clarify-the_Heat got an honorable mention, but then so did half the 13 teams present, and I won a FlirONE in one of the hourly draws 🙂 It looks like they will be priced around $250 when they go on sale in mid-August. I wonder how long it will take before they are integrated into phones (yet more megapixels in the visual spectrum is a bit pointless)?
I thought the best project of the event was by James Rampersad, who used processed the IR video stream using Eulerian Video Magnification to how blood pulsing through his face.
High value IP auctions, finally a way to moneterise the blockchain
Team High-value-IP-auctions (Gary, Shlomie and yours truly) were at Hackcoin today. We targeted the opposite end of the market from Team Long Tail Licensing, i.e., high value at very low volume rather than low value at high volume.
One of the event sponsors was Nxt, a cryptocurrency I had not previously heard of. Nxt is unusual in that it is exclusively focused on the use of the blockchain as a tool for building applications, there is no mining to create new currency (it is based on proof-of-stake, which was all distributed at genesis). I was surprised at how well developed the software and documentation appeared to be (a five hour hack does not leave time for a detailed analysis).
So you have some very interesting information and want to provide a wealthy individual the opportunity to purchase exclusive access to it. There is a possibility that the individual concerned might not be very sporting about this opportunity and it would be prudent for the seller to remain anonymous throughout the negotiation and payment process.
A cryptocurrency blockchain is the perfect place to deposit information for which a global audience might be needed at some point in the future. The information can be stored in encrypted form (where it can hide in plain sight with all the other encrypted content), it will be rapidly distributed to a wide variety of independent systems and following a few simple rules allows the originating source to remain anonymous.
The wealthy individual gets sent details on how to read the information (i.e., a decryption key and a link to the appropriate block in the blockchain) and the Nxt account number where the requested purchase price should be deposited.
Once events have been set in motion the seller may not have reliable access to the Internet and would prefer a third party to handle the details.
The third party could be a monitor program running in the cloud (perhaps independent copies running on Amazon, Azure and Google to provide redundancy). This monitor program sleeps until the end of the offer period and then sends a request for the current balance on the account being used. If the account does not contain the purchase price, the encryption key and appropriate link is tweeted, otherwise the monitor program shuts itself down.
Those of you who don’t have any information that wealthy individuals might want to purchase could use this approach to run a kick-starter campaign, or any sale of digital goods that involved triggering product release after a minimum monetary amount is reached within a given amount of time.
Does the third party monitor program have to run outside of a blockchain environment? Perhaps it could be executed as a smart contract inside a crytpocurrency such as Ethereum. I did see mention of smart contracts inside Nxt, but unless I missed something they are not supported by the base API.
The designers of the Nxt blockchain have appreciated that they need a mechanism to stop it becoming weighed down by long dead information. The solution is pruned data, data that is removed from the blockchain after a period of time (the idea that a blockchain is an immutable database is great in theory, but dooms any implementation to eventual stasis).
Does our wealthy individual have any alternative options? Perhaps the information is copyright and the lawyers can be unleashed. I doubt that lawyers could prevent the information being revealed in this case, but copyright infringement via the blockchain is an issue that has yet to explode on the world.
The implementation was surprisingly straightforward and the only feature not yet working at the time of our presentation was tweeting of encryption key. We won first prize of 1-bitcoin!
Is your interesting project on hold because of lack of sufficient cpu time?
Do you have an interesting project that is stalled because of lack of cloud compute resources? If so I know some guys who may be able to help.
One of the prizes at a recent hackathon was around $8k of cloud computing per month for a year. The guys who won it have not been using the monthly allowance and would like to put it to good use.
What counts as an “interesting project”? You are dealing with hackers who enjoy working at the edge of things and want to be involved in a project that impresses other hackers (here ‘involved’ means telling other people they are involved, not actually helping you with the project in any way). While it is obviously a project that uses computers it does not have to be about computing. Helping your me-to-startup is very unlikely to be interesting.
Hackers are fans of open data, so you will have to have a very good reason not to make any data you produce public.
Send me an email briefly describing your project, why it needs this cloud computing resource and show that you will not fritter it away because you don’t know what you are doing.
The clock is ticking.
Aggregate player preference for the first 20 building created in Illyriad
I was at the Microsoft Gaming data hackathon today. Gaming is very big business and companies rarely publish detailed game data. Through contacts one of the organizers was able to obtain two gaming datasets, both containing just under 300M of compressed of data.
Illyriad supplied a random snapshot of anonymised data on 50,000 users and Mediatonic supplied three months of player data.
Being a Microsoft event there were lots of C# developers, with data analysis people being thin on the ground. While there were plenty of gamers present I could not find any that knew the games for which we had data (domain experts are always in short supply at hackathons).
I happened to pick the Illyriad data to investigate first and stayed with it. The team sitting next to us worked on the Mediatonic data and while I got to hear about this data and kicked a few ideas around with them, I did not look at it.
The first thing to do with any dataset is to become familiar with what data it actually contains and the relationships between different items. I was working with two people new to data science who wanted to make the common beginner mistake of talking about interesting things we could do; it took a while for my message of “no point of talking about what we could do with the data until we know what data we have” to have any effect. Of course it is always worth listening to what a domain expert is interested in before looking at the data, as a source of ideas to keep in mind; it is not worth keeping in mind ideas from non-domain experts.
Quick Illyriad game overview: Players start with a settlement and construct/upgrade buildings until they have a legendary city. These buildings can generate resources such as food and iron; towns/cities can be conquered and colonized… you get the picture.
My initial investigation of the data did not uncover any of the obvious simple patterns, but did manage to find a way of connecting some pairs of players in a transaction relationship (the data for each player included a transaction list which gave one of 255 numeric locations and the transaction amount; I reasoned that the location/amount pair was likely to be unique).
The data is a snapshot in time, which appeared to rule out questions involving changes over time. Finally, I realized that time data was present in the form of the order in which each player created buildings in their village/town/city.
Buildings are the mechanism through which players create resources. What does the data have to say about gamers preferential building construction order? Do different players with different playing strategies use different building construction orders?
A search of the Illyriad website located various beginners’ guides containing various strategy suggestions, depending on player references for action.
Combining the order of the first 20 different buildings, created by all 50,000 players, into an aggregate preference building order we get:
Library Storehouse Lumberjack Clay Pit Farmyard Marketplace Quarry Iron Mine Barracks Consulate Mage Tower Paddock Common Ground Brewery Tavern Spearmaker Tannery Book Binder Flourmill Architects` Office |
A couple of technical points: its impractical to get an exact preference order for more than about 10 players and a Monti Carlo approach is used by RankAggreg and building multiple instance of the same kind of building were treated as a single instance (some form of weighting might be used to handle this behavior):
The order of the top three ranked buildings is very stable, but some of the buildings in lower ranks could switch places with adjacent buildings with little impact on ranking error.
Do better players use different building orders than poor players? The data does not include player ability data as such; it included game ranking (a high ranking might be achieved quickly by a strong player or slowly over a longer period by a weaker player) and various other rankings (some of which could be called sociability).
Does the preference for buildings change as a players’ village becomes a town becomes a city? At over 200 minutes of cpu time per run I have not yet had the time to find out. Here is the R code for you to try out some ideas:
library("plyr")
library("RankAggreg")

get_build_order=function(df)
{
# Remove duplicates for now
dup=duplicated(df$building_id)

# Ensure there are at least 20
build_order=c(df$building_id[!dup], -1:-20)
return(build_order[1:20])
}

# town_id,building_id,build_order_for_town
#1826159E-976D-4743-8AEB-0001281794C2,7,1
build=read.csv("~/illyriad/town_buildings.csv", as.is=TRUE)

build_order=daply(build, .(town_id), get_build_order)

build_rank=RankAggreg(build_order, 20) |
What did other teams discover in the data? My informal walk around on Saturday evening found everybody struggling to find anything interesting to talk about (I missed the presentation on Sunday afternoon, perhaps a nights sleep turned things around for people, we will have to check other blogs for news).
If I was to make one suggestion to the organizers of the next gaming data hackathon (I hope there is one), it would be to arrange to have some domain experts (i.e., people very familiar with playing the games) present.
ps. Thanks to Richard for organizing chicken for the attendee who only eats pizza when truly starving.
Update
Finding team members and an idea at a hackathon
You have chosen a hackathon (discussed in a previous post), your application to attend was accepted (usually only turned down because the venue is full), now what do you do? If they are organized (some are not) the people running the event will have a web page containing a list of possible problems/challenges, possible sources of data, judging criteria and other information; read this several times. It is helpful to turn up on the days with several possible project ideas, so keep you mind open in the weeks/days before the event to workable ideas. Depending how keen you are you might also search the Internet for information that could help.
Most events have a rule that all coding must be done on the day, i.e., no turning up on the day with a half finished App.
So you arrive at the venue and sign in, what next? You need team members (assuming you have not formed team beforehand). Yes, you are usually allowed to work on your own but why bother attending if you plan to do this, you might just as well work from home and just turn up to present at the end.
My choice of possible team members is driven by my reason for attending hackathons, I enjoy building software systems. So I look for other developers and perhaps a subject domain expert for advice. My social mingling gets straight to the point, after saying hello I ask the person in front of me what language they like to code in, maybe 20% give a reply that shows they are a developer.
If you reason for attending is to teach then there will be people who are “there to learn”, if you like listening to other people rabbit on about their ideas then there will be “ideas people” and if you don’t get enough of non-technical managers during the week you will probably have first pick of those present. In theory everybody should want a “designer” on their team, in practice people who cannot code but think they can do “something” say they are “designers”.
If you are looking to build something I recommend avoiding anybody who cannot code (or build hardware if at a hardware hack) like the plague. These people soak up a huge amount of discussion time and when it comes down to it do not contribute much towards what is being built (I have seen non-developers make a crucial contribution to a team, but then monkeys will eventually type Shakespeare). Of course, outside of a hackathon context non-developers are needed.
I recommend keeping your team small, no more than four people. Depending on what you are building it may not be possible to split the work between more than two people (I have won several times in a team of two), or perhaps three. If you find yourself in a group of more than four I suggest that you agree to kick around ideas together and then split into smaller teams, it is unlikely that everybody will be interested in working on the same idea.
You will need an idea for what to build. Don’t be shy about sharing your ideas and asking other people what their ideas are. This is where letting things tick over in your mind before the event helps; you will probably have a couple of ideas to start things off.
Everybody thinks their own ideas are great and that other people at the hackathon will steal them if they can. In practice convincing other people that your idea is worth their time is hard work; be prepared to sell your idea to a group of people who are as skeptical, but willing to go for it, as you are.
I have never seen it written down, but there is a view that what you build has to have something unique about it, at least if you want to be win in some category. Be prepared to feel very deflated when somebody points you at a site implementing exactly what you are proposing, only much better; this happens to me on a regular basis.
So you are part of a team, have some ideas and are all sitting around a table plugging in your laptops. You will probably spend several more hours talking things through and maybe searching the internet. You might still be talking 10 hours later (only happened to me once before).
At a hackathon you are always free to get up and leave your team. Of course as time goes by other teams are more likely to have jelled and be less inclined to accept a new member. If things are really going nowhere, you can always go home.
To be continued…
Finding and choosing a hackathon to attend
Lots of developers seem to be interested in Hackathons but are not sure where to find out about them or what’s involved. This is part one of a summary of what I know about hackathons, based on a couple of years of going to them (mostly in and around London, my participation was sporadic until last year); the next article will offer some suggestions for what to do at a hackathon.
Hackathons-and-Jams UK is a great source of information about London based events; its a group on meetup.com which is the site to find out about out-of-work computer related get togethers; some of the other meetup groups that host events include: Data Science London, DataKind UK and Microservices Hackathon.
Eventbrite is often used by event organizers for attendee sign-up and searching this site using the obvious keywords is worthwhile.
The UK Hackspace Foundation lists more local groups meeting on a regular basis, an some hold hackathons.
Now you have a list of forthcoming events, which ones are worth attending (assuming a place is free; this year’s Battlehack ‘sold-out’ in six seconds)? I choose events based on how interesting they look and given a choice prefer those where I will be more relaxed (e.g., likely to have a comfortable place to sit, reasonable food and no noise) and much prefer 24 hr hacks (which usually start Saturday and finish Sunday); evening events are over almost before they have started. Events can be roughly classified as follows:
- Data driven: sponsors provide lots of data relating to a topic, or access to an API, and people have to use this to create something,
- Create anything: completely open-ended, as long as you make use of one of the sponsor’s API in some form,
- Create anything in hardware: a hardware hack essentially boils down to hanging peripherals off a single board computer and making something happen.
I cannot give you any useful advice about what interests you (apart from suggesting that you ignore details of what the actual prizes are, just have fun and aim to produce something that wows the crowd), but I can provide a few tips on evaluating venues.
My top two venues are The Hub Westminster (very comfy seats, a great atmosphere, plenty of local shops and food often good {but Pret does get tedious}) and Level 39 at Canary Wharf (fantastic food and great views).
The venue I try to avoid is the Google Campus, a 1960s bunker packed with solid wooden furniture to deform your body and numb your behind; a very low cost venue that Google are happy to let startups to use for almost nothing in some cases.
In general events held in company/university canteens will be uncomfortable places to hack (these places are designed to get people to leave after they have eaten) and often have WiFi that cannot support too many users at the same time.
Hackathons are generally free; non-free ones are treated with suspicion (but some will return your registration fee when you turn up, a way of ensuring people will only book if they really plan to attend; it not unusual for 50% of those registered not to show up on the day). The deal is that you use the sponsors’ API (and so become familiar with their product) and they feed and water you.
Generally you get to keep copyright and any IP, although posting the code to sites such as Github is encouraged. Some financial services hacks have terms & conditions that require you to sign over your soul. Its your soul, your call.
Semantic vs phonetic similarity for word pairs: a weekend investigation
The Computational Semantics hackathon was one of the events I attended last weekend. Most if the suggested problems either looked like they could not reasonably be done in a weekend (it ran 10:00-17:00 on both days, I know academics hacks) or were uninspiring coding problems. Chatting to some of the academics present threw up an interesting idea that involved comparing word pair semantic and phonetic similarity (I have written about my interest in sounds-like and source code identifiers).
Team Semantic-sounds consisted of Pavel and yours truly (code and data).
The linguists I chatted to seemed to think that there would be a lot of word pairs that sounded alike and were semantically similar; I did not succeed it getting any of them to put a percentage to “a lot”. From the human communication point of view, words that both sound alike and have a similar meaning are likely to be confused with each other; should such pairs come into existence they are likely to quickly disappear, at least if the words are in common usage. Sound symbolism related issues got mentioned several times, but we did not have any data to check out the academic enthusiasm.
One of the datasets supplied by the organizers was word semantic similarity data extracted from the Google news corpus. The similarity measure is based on similarity of occurrence, e.g., the two sentences “I like licking ice-cream” and “I like eating ice-cream” suggest a degree of semantic similarity between the words licking and eating; given enough sentences containing licking and eating there are clever ways of calculating a value that can be viewed as a measure of word similarity.
The data contained 72,000+ words, giving a possible half a billion pairs (most having zero similarity). To prune this down a bit we took, for each word, the 150 other words that were most similar to it, giving around 10 million word pairs. Each word was converted to a phoneme sequence and a similarity distance calculated for each pair of phoneme sequences (which we called phonetic distance and claimed it was a measure of how similar the words sounded to each other).
The list of word pairs with high semantic/phonetic similarity was very noisy, with lots of pairs containing the same base word in plural, past tense or some other form, e.g., billion and billions. A Porter stemmer was used to remove all pairs where the words shared the same stem, reducing the list to 2.5 million pairs. Most of the noise now came from differences in British/American spelling. We removed all word pairs that contained a word that was not in the list of words that occurred in the common subset of the British and American dictionaries used by aspell; this reduced the list to half a million pairs.
The output contained some interesting pairs, including: faultless/flawless, astonishingly/astoundingly, abysmal/dismal and elusive/illusive. These look like rarely used words to me (not enough time to add in word frequency counts).
Some pairs had surprisingly low similarity, e.g., artifact/artefact (the British/American spelling equality idea has a far from perfect implementation). Is this lower than expected semantic similarity because there is a noticeable British/American usage difference? An idea for a future hack.
A smoothed scatter plot of semantic vs phonetic similarity (for the most filtered pair list) shows lots of semantically similar pairs that don’t sound alike, but a few that do (I suspect that most of these are noise that better stemming and spell checking will filter out). The following uses Levenshtein distance for phoneme similarity, normalised by the maximum distance for a given phoneme sequence with all phoneme differences having equal weight:

and using Jaro-Winkler distance (an alternative distance metric that is faster to calculate):

The empty band at low phonetic similarity is an artifact of the data being quantized (i.e., words contain a small number of components).
Is it worth going to the trouble of comparing phoneme sequences? Would comparing letter sequences be just as good? The following plot shows word pair letter distance vs phonetic similarity distance (there is a noticeable amount of off-diagonal data, i.e., for some pairs letter/phoneme differences are large):

Its always good to have some numbers to go with graphical data. The following is the number of pairs having a given phonetic similarity (remember the starting point was the top 150 most semantically similar pairs). The spikes are cause by the discrete nature of word components.

Squinting at the above it is possible to see an exponential decline as phonetic word similarity increases. It would be interesting to have enough data to display a meaningful 3D plot, perhaps a plane can be fitted (with a log scale on the z-axis).
Rather than using the Google news corpus data as the basis of word pair semantic similarity we could have used the synonym sets from Wordnet. This rather obvious idea did not occur to me until later Saturday and there was no time to investigate. How did the small number of people who created the Wordnet data come up with lists of synonyms? If they simply thought very hard they might have been subject to the availability bias, preferentially producing lists of synonyms that contained many words that sounded alike because those that did not sound alike were less likely to be recalled. Another interesting idea to check out at another hack.
It was an interesting hack and as often happens more new questions were raised than were answered.
A disheartening Space Apps hackathon
Every hackathon has its share of crazies, fortunately they rarely achieve sufficient critical mass to bother anybody else, generally wandering harmlessly around the venue. Hackathons involving outer space attracts crazies in droves and much of the first day is spent with everybody floating around in zero gravity.
This morning I stopped by the NASA SpaceApp hackathon in London to pick up my pass, say hi to a few people I knew were going and let them know I would be back later. A computational semantics hackathon was happening a few miles away, but finishing for the day at five (I know, academic hackathons). My plan was do interesting language analysis stuff, giving the crazies plenty of time to save the world (and then leave), before I returned to spend the rest of the weekend hacking on something space’ish.
The computational semantics hack was as interesting as it promised to be and I’m returning to it tomorrow (not the original plan).
I returned to the SpaceApp hack to find that while most of the crazies had gone, a lot of developers had also left. Had the crazies caused those with a firmer grip on reality to flee to the hills? The lack of coffee (yes, I did check several times that there were no plans to supply any coffee for the duration) and the wifi not being able to support everybody could not have helped. The few developers left (a fare few engineers, designers and ‘ideas’ people were still there) seemed to have been reduced to nibbling away at uninteresting bits (to me at least) of big problems. I left disheartened.
I think that part of the reason that non-crazies have trouble connecting with NASA’s proposed plans is that it is hard to tell the difference between NASA and the crazies. NASA’s mission has always been about politics first and science second. First as a means of boosting the US image around the world (the moon landing years) and then as a means of pork-barrel funding for favored politicians. To keep serious funding rolling in NASA has to ignite the public imagination. Fortunately for them the public is not very good at working out the economics of the proposed ventures (e.g., Google search on economics of asteroid mining to find plenty of articles exposing the economics flaws of this proposal).
While I am happy for the US taxpayer to funding NASA to do interesting space stuff and share it with the rest of the world, I do wish they could do it in a way that made technical and economic sense (I have no problem with them feeding the crazies, who have as much right to enjoy hackathons as the rest of us).
Been invaded by mysterious sounds? You need SoundHound
Team SoundHound (Gary, Pavel and yours truly) were at the Intel Hardware Hackathon last weekend. Hardware hacks are about the peripherals that are available on the day; I grabbed one of everything and we all sat down to play with them and come up with a great gadget to build. At an Intel sponsored event the computers are obviously Galileo and Edison (which is what we ended up using).
The Intel guys had a very fixed idea about how the hackathon was to run and specified that eight projects had to be proposed and selected (by everybody present) on the Friday night and that these would be worked on over the weekend (but we were allowed to change the idea; the logic escaped me). I proposed a vibration detection project to measure the impact of passing vehicles on houses next to busy roads. Nobody on what was to become SoundHound thought this was a great idea, but it was the only idea we had and there was nothing stopping us radically changing our mind over the weekend.
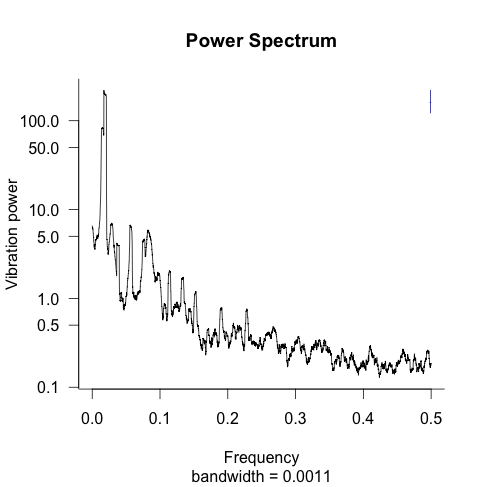
Vehicles generate sound which we can hear, but buildings are damaged by the lower frequency vibrations that we sometimes feel but don’t usually hear. A microphone would be useless, what was needed was a vibration sensor and a packet of piezo vibration sensors, the SEN-09198, was provided. We did not have any amplifiers to boost the signal, so the sensors were wired directly onto the signal pins; this meant that the dynamic range of the signal was about 50 times smaller than the input could handle and our test vibrations were created by banging on the table on which the sensor sat (power spectrum of me doing just that below).
We worked away on the vehicle vibration idea waiting for something better to come along. Some household appliances contain motors that cause them to vibrate, perhaps we could detect these vibrations. The use case here was a fridge next to a wall transmitting vibration into another room which then generated a hard to pin-down noise in that room. Around this time it occurred to us that a ghost detector (everybody knows that walls vibrate when ghosts travel through them) might be a bigger market, after all occult books sell well.
IBM were an event sponsor and had people on-hand to help us set up and use Bluemix, their cloud offering. The Edison board was communicating with our laptops via wifi and this got rerouted so the data was sent to IBM’s cloud storage. Collecting everybodies vibration data meant we could do pattern matching on the power spectrum of the vibration to identify candidates for the device most likely to be generating it (whether the vibration characteristics of different devices is sufficiently different for the pattern matching to be able to distinguish them at some useful level is another matter; I imagine that the shape of a fridge causes its vibration to modulate slightly from the frequency of the local electricity supply).
One of the problems of producing a working demo at a hackathon is being held to a much higher standard of reality. Teams whose output is slideware illustrating the tenuous connection its members have to reality don’t seem to have any trouble getting unquestioning agreement that anything they propose will just work. We were asked how we would obtain the vibration data for different household devices, against which the customer data could be compared; a marketing type capable of convincingly talking about our crowd source solution would have been useful.
Late Saturday afternoon saw team SoundHound out on the streets measuring vehicle vibration. Unfortunately large lorries traveling at speed are thin on the ground in central London, also guys standing next to a laptop with wires attached to something on the ground filming everything that went past had the effect of causing drivers to slow down to low vibration speeds (rather than speeding up to get away from us).
Perhaps we should have gone with the ghost detector sale pitch. The cloud data storage could have been rebranded as The Ethereum data matrix and flashing leds added to the hand-held sensor (the penguins below send the wrong message).
If it is possible to distinguish home appliances based on their vibration characteristics, and a database is created, there is an opportunity for salesmen to systematically check each house/flat ‘listening’ for appliances that are close to failing (motors vibrate more as they wear out): “Hello Sir, your fridge/boiler/air-conditioning is getting old and this week we have a special offer on replacements…”.
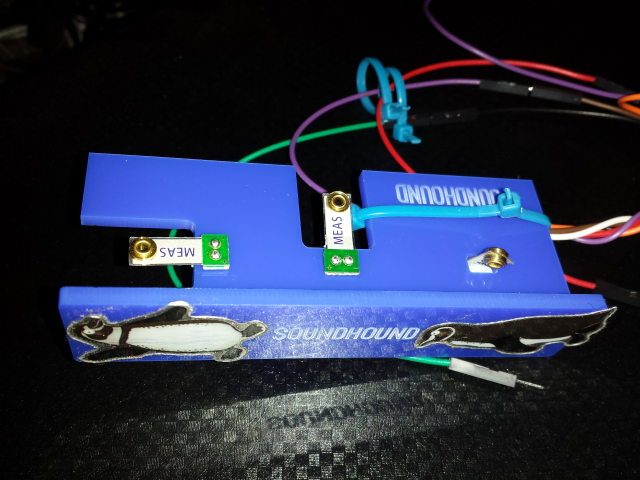
The picture below shows our 3-axis vibration sensor (plastic mounting/vibration interface laser cut by Elen from the FabLab, who do brown bag lunch and learn sessions if you are ever in central London). Two axis would probably been enough, and maybe even one, but we had the sensors and wanted to impress.
Recent Comments