Archive
Hardware/Software cost ratio folklore
What percentage of data processing budgets is spent on software, compared to hardware?
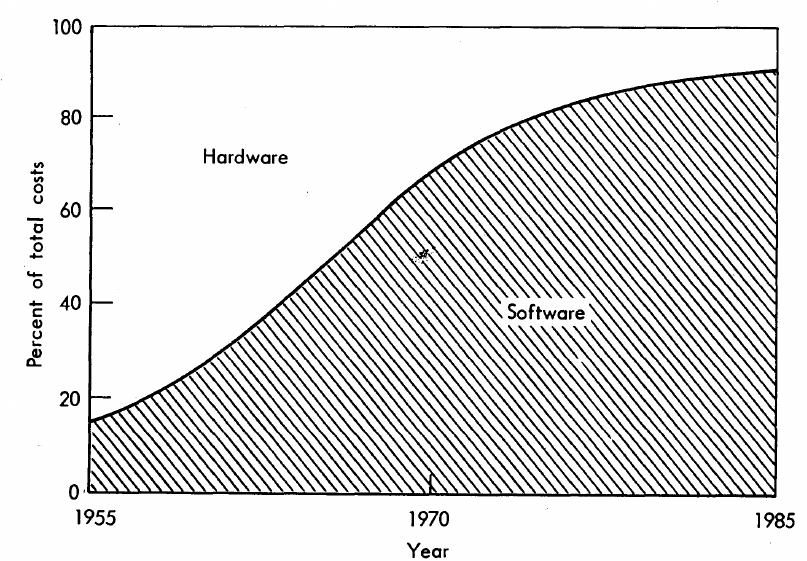
The information in the plot below quickly became, and remains, the accepted wisdom, after it was published in May 1973 (page 49).
Is this another tale from software folklore? What does the evidence have to say?
What data did Barry Boehm use as the basis for this 1973 article?
Volume IV of the report Information processing/data automation implications of Air-Force command and control requirements in the 1980s (CCIP-85)(U), Technology trends: Software, contains this exact same plot, and Boehm is a co-author of volume XI of this CCIP-85 report (May 1972).
Neither the article or report explicitly calls out specific instances of hardware/software costs. However, Boehm’s RAND report Software and Its Impact A Quantitative Assessment (Dec 1972) gives three examples: the US Air Force estimated they will spend three times as much on software compared to hardware (in early 1970s), a military C&C system ($50-100 million hardware, $722 million software), and recent NASA expenditure ($100 million hardware, $200 million software; page 41).
The 10% hardware/90% software division by 1985 is a prediction made by Boehm (probably with others involved in the CCIP-85 work).
What is the source for the 1955 percentage breakdown? The 1968 article Software for Terminal-oriented systems (page 30) by Werner L. Frank may provide the answer (it also makes a prediction about future hardware/software cost ratios). The plot below shows both the Frank and Boehm data based on values extracted using WebPlotDigitizer (code+data):
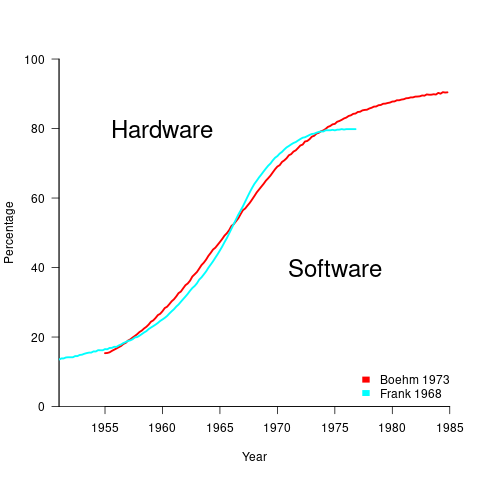
What about the shape of Boehm’s curve? A logistic equation is a possible choice, given just the start/end points, and fitting a regression model finds that  is an almost perfect fit (code+data).
How well does the 1972 prediction agree with 1985 reality?
At the start of the 1980s, two people wrote articles addressing this question: The myth of the hardware/software cost ratio by Harvey Cragon in 1982, and The history of Myth No.1 (page 252) by Werner L. Frank in 1983.
Cragon’s article cites several major ecosystems where recent hardware/software percentage ratios are comparable to Boehm’s ratios from the early 1970s, i.e., no change. Cragon suggests that Boehm’s data applies to a particular kind of project, where a non-recurring cost was invested to develop a new software system either for a single deployment or with more hardware to be purchased at a later date.
When the cost of software is spread over multiple installations, the percentage cost of software can dramatically shrink. It’s the one-of-a-kind developments where software can consume most of the budget.
Boehm’s published a response to Cragon’s article, which answered some misinterpretations of the points raised by Cragdon, and finished by claiming that the two of them agreed on the major points.
The development of software systems was still very new in the 1960s, and ambitious projects were started without knowing much about the realities of software development. It’s no surprise that software costs were so great a percentage of the total budget. Most of Boehm’s articles/reports are taken up with proposed cost reduction ideas, with the hardware/software ratio used to illustrate how ‘unbalanced’ the costs have become, an example of the still widely held belief that hardware costs should consume most of a budget.
Frank’s article references Cragon’s article, and then goes on to spend most of its words citing other articles that are quoting Boehm’s prediction as if it were reality; the second page is devoted 15 plots taken from these articles. Frank feels that he and Boehm share the responsibility for creating what he calls “Myth No. 1” (in a 1978 article, he lists The Ten Great Software Myths).
What happened at the start of 1980, when it was obvious that the software/hardware ratio predicted was not going to happen by 1985? Yes, obviously, move the date of the apocalypse forward; in this case to 1990.
Cragon’s article plots software/hardware budget data from an uncited Air Force report from 1980(?). I managed to find a 1984 report listing more data. Fitting a regression model finds that both hardware and software growth is deemed to be quadratic, with software predicted to consume 84% of DoD budget by 1990 (code+data).
Did software consume 84% of the DoD computer/hardware budget in 1990? Pointers to any subsequent predictions welcome.
Having all the source code in one file
An early, and supposedly influential, analysis of the Coronavirus outbreak was based on results from a model whose 15,000 line C implementation was contained in a single file. There has been lots of tut-tutting from the peanut gallery, about the code all being in one file rather than distributed over many files. The source on Github has been heavily reworked.
Why do programmers work with all the code in one file, rather than split across multiple files? What are the costs and benefits of having the 15K of source in one file, compared to distributing it across multiple files?
There are two kinds of people who work with code all in one file, novices and really capable developers. Richard Stallman is an example of a very capable developer who worked using files containing huge amounts of code, as anybody who looked at the early sources of gcc will be all to familiar.
The benefit of having all the code in one file is that it is easy to find stuff and make global changes. If the source is scattered over multiple files, then working on the code entails knowing which file to look in to find whatever; there is a learning curve (these days screens have lots of pixels, and editors support multiple windows with a different file in each window; I’m sure lots of readers work like this).
Many years ago, when 64K was a lot of memory, I sometimes had to do developer support: people would come to me complaining that the computer was preventing them writing a larger program. What had happened was they had hit the capacity limit of the editor. The source now had to be spread over multiple files to get over this ‘limitation’. In practice people experienced the benefits of using multiple files, e.g., editor loading files faster (because they were a lot smaller) and reduced program build time (because only the code that changed needed to be recompiled).
These days, 15K of source can be loaded or compiled in a blink of an eye (unless a really cheap laptop is being used). Computing power has significantly reduced these benefits that used to exist.
What costs might be associated with keeping all the source in one file?
Monolithic code makes sharing difficult. I don’t know anything about the development environment within which these researched worked. If there were lots of different programs using the same algorithms, or reading/writing the same file formats, then code reuse often provides a benefit that makes it worthwhile splitting off the common functionality. But then the researchers has to learn how to build a program from multiple source files, which a surprising number are unwilling to do (at least it has always been surprising to me).
Within a research group, sharing across researchers might be a possible (assuming they are making some use of the same algorithms and file formats). Involving multiple people in the ongoing evolution of software creates a need for some coordination. At the individual level it may be more cost-efficient for people to have their own private copies of the source, with savings only occurring at the group level. With software development having a low status in academia, I don’t see any of the senior researchers willingly take on a management role, for this code. Perhaps one of the people working on the code is much better than the others (it often happens), but are they going to volunteer themselves as chief dogs body for the code?
In the world of Open Source, where source code is available, cut-and-paste is rampant (along with wholesale copying of files). Working with a copy of somebody else’s source removes a dependency, and if their code works well enough, then go for it.
A cost often claimed by the peanut gallery is that having all the code in a single file is a signal of buggy code. Given that most of the programmers who do this are novices, rather than really capable developers, such code is likely to contain many mistakes. But splitting the code up into multiple files will not reduce the number of mistakes it contains, just distribute them among the files. Correlation is not causation.
For an individual developer, the main benefit of splitting code across multiple files is that it makes developers think about the structure of their code.
For multi-person projects there are the added potential benefits of reusing code, and reducing the time spent reading other people’s code (it’s no fun having to deal with 10K lines when only a few functions are of interest).
I’m not saying that the original code is good, bad, or indifferent. What I am saying is that the having all the source in one file may, or may not, be the most effective way of working. It’s complicated, and I have no problem going with the flow (and limiting the size of the source files I write), but let’s not criticise others for doing what works for them.
Three books discuss three small data sets
During the early years of a new field, experimental data relating to important topics can be very thin on the ground. Ever since the first computer was built, there has been a lot of data on the characteristics of the hardware. Data on the characteristics of software, and the people who write it has been (and often continues to be) very thin on the ground.
Books are sometimes written by the researchers who produce the first data associated with an important topic, even if the data set is tiny; being first often generates enough interest for a book length treatment to be considered worthwhile.
As a field progresses lots more data becomes available, and the discussion in subsequent books can be based on findings from more experiments and lots more data
Software engineering is a field where a few ‘first’ data books have been published, followed by silence, or rather lots of arm waving and little new data. The fall of Rome has been followed by a 40-year dark-age, from which we are slowly emerging.
Three of these ‘first’ data books are:
- “Man-Computer Problem Solving” by Harold Sackman, published in 1970, relating to experimental data from 1966. The experiments investigated the impact of two different approaches to developing software, on programmer performance (i.e., batch processing vs. on-line development; code+data). The first paper on this work appeared in an obscure journal in 1967, and was followed in the same issue by a critique pointing out the wide margin of uncertainty in the measurements (the critique agreed that running such experiments was a laudable goal).
Failing to deal with experimental uncertainty is nothing compared to what happened next. A 1968 paper in a widely read journal, the Communications of the ACM, contained the following table (extracted from a higher quality scan of a 1966 report by the same authors, and available online).
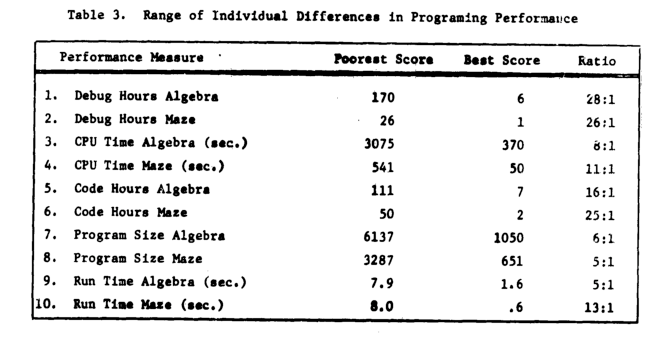
The tale of 1:28 ratio of programmer performance, found in an experiment by Grant/Sackman, took off (the technical detail that a lot of the difference was down to the techniques subjects’ used, and not the people themselves, got lost). The Grant/Sackman ‘finding’ used to be frequently quoted in some circles (or at least it did when I moved in them, I don’t know often it is cited today). In 1999, Lutz Prechelt wrote an expose on the sorry tale.
Sackman’s book is very readable, and contains lots of details and data not present in the papers, including survey data and a discussion of the intrinsic uncertainties associated with the experiment; it also contains the table above.
- “Software Engineering Economics” by Barry W. Boehm, published in 1981. I wrote about the poor analysis of the data contained in this book a few years ago.
The rest of this book contains plenty of interesting material, and even sounds modern (because books moving the topic forward have not been written).
- “Program Evolution: Process of Software Change” edited by M. M. Lehman and L. A. Belady, published in 1985, relating to experimental data from 1977 and before. Lehman and Belady managed to obtain data relating to 19 releases of an IBM software product (yes, 19, not nineteen-thousand); the data was primarily the date and number of modules contained in each release, plus less specific information about number of statements. This data was sliced and diced every which way, and the book contains many papers with the same data appearing in the same plot with different captions (had the book not been a collection of papers it would have been considerably shorter).
With a lot less data than Isaac Newton had available to formulate his three laws, Lehman and Belady came up with five, six, seven… “laws of software evolution” (which themselves evolved with the publication of successive papers).
The availability of Open source repositories means there is now a lot more software system evolution data available. Lehman’s laws have not stood the test of more data, although people still cite them every now and again.
Average maintenance/development cost ratio is less than one
Part of the (incorrect) folklore of software engineering is that more money is spent on maintaining an application than was spent on the original development.
Bossavit’s The Leprechauns of Software Engineering does an excellent job of showing that the probably source of this folklore did not base their analysis on any cost data (I’m not going to add to an already unwarranted number of citations by listing the source).
I have some data, actually two data sets, each measuring a different part of the problem, i.e., 1) system lifetime and 2) maintenance/development costs. Both sets of measurements apply to IBM mainframe software, so a degree of relatedness can be claimed.
Analyzing this data suggests that the average maintenance/development cost ratio, for a IBM applications, is around 0.81 (code+data). The data also provides a possible explanation for the existing folklore in terms of survivorship bias, i.e., most applications do not survive very long (and have a maintenance/development cost ratio much less than one), while a few survive a long time (and have a maintenance/development cost ratio much greater than one).
At any moment around 79% of applications currently being maintained will have a maintenance/development cost ratio greater than one, 68% a ratio greater than two and 51% a ratio greater than five.
Another possible cause of incorrect analysis is the fact we are dealing with ratios; the harmonic mean has to be used, not the arithmetic mean.
Existing industry practice of not investing in creating maintainable software probably has a better cost/benefit than the alternative because most software is not maintained for very long.
Recent Comments