Archive
Software engineering as a hedonistic activity
My discussions with both managers and developers on software development processes invariably end up on the topic of developer happiness. Managers want to keep their development teams happy, and there is a longstanding developer culture of entitlement to work that they find interesting.
Companies in general want to keep their employees happy, irrespective of the kind of work they do. What makes developers different, from management’s perspective, is that demand for good software developers far outstrips supply.
Many developers approach software engineering as a hedonistic activity; yes, there are those who only do it for the money.
The huge quantity of open source software, much of it written out of personal interest rather than paid employment, provides evidence for there being many people willing to create software because of the pleasure they get from doing it.
Software developers only get to indulge in hedonistic development activities (e.g., choosing which tools to use, how to structure their code, and not having to provide estimates) because of the relative ease with which competent developers can obtain another job. Replacing developers is time-consuming and expensive, which gives existing employees a lot of bargaining power with management.
Some of the consequences of managements’ desire to keep developers happy, or at least not unhappy include:
- Not pushing too hard for an estimate of the likely time needed to complete a task,
- giving developers a lot of say in which languages/tools/packages they use. This creates a downstream need to support a wider variety of development ecosystems than might otherwise have been necessary, and further siloing development teams,
- allowing developers to spend time beautifying their code to meet personal opinions about the visual appearance of source.
The balance of power that facilitates hedonism driven development is determined by the relative size of the employment market in the supply and demand for software developers. Once demand falls below the available supply, finding a new job becomes more difficult, shifting the balance of power away from developers to managers.
I am not expecting supply to exceed demand any time soon. While International computer companies have been laying off lots of staff, demand from small companies appears to be strong (based on the ever-present ‘We’re hiring’ slides I regularly see at London meetups), but things may change. Tools such as ChatGPT are far from good enough to replace developers in the near term.
Overview of broad US data on IT job hiring/firing and quitting
Software developers are employed by organizations and people change jobs, either voluntarily or not; every year a new batch of people join the workforce, e.g., new graduates. Governments track employment activities for a variety of reasons, e.g., tax collection, and monitoring labour supply and demand (for the purposes of planning).
The US Bureau of Labor Statistics’ publishes a monthly summary of their Job Openings and Labor Turnover Survey. What can be learned about software development employment from this data (description)?
The data starts in December 2000, with each row contains a monthly count of Job Openings, Hires, Quits, Layoffs and Discharges, and totals, along with one of 21 major non-farm industry codes or one of the 5 government codes (the counts are broken out by State). I’m guessing that software developers are assigned the Information code (i.e., 510000), but who is to say that some have not been classified with the code for, say, Construction or Education and health services. The Information code will cover a lot more than just software developers; I’m trading off broad IT coverage for monthly details on employment turnover (software developer specific information is available, but it comes without the turnover information). The Bureau of Labor Statistics make available a huge quantity of information, and understanding how it all fits together would probably require me to spend several months learning my way around (I have already spent a week or two over the years), so I’m sticking with a prebuilt dataset.
The plot below shows the aggregated monthly counts (i.e., all states) of Job Openings, Hires, Quits, Layoffs and Discharges for the Information industry code (code+data):
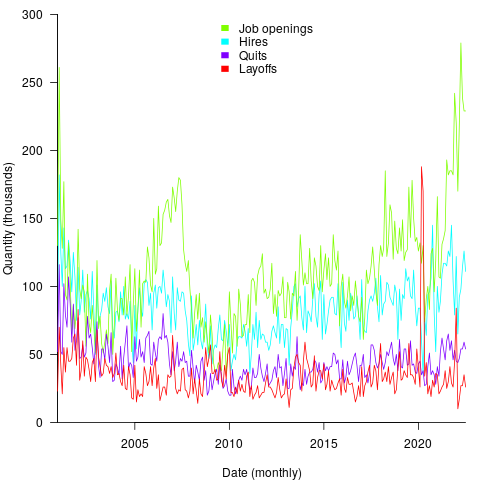
The general trend follows the ups and downs of the economy, there is a huge spike in layoffs in early 2020 (the start of COVID), and Job Openings often exceeding Hires (which I did not expect).
These counts have the form of a time-series, which leads to the questions about repeating patterns in the sequence of values? The plot below shows the autocorrelation of the four employment counts (code+data):

The spike in Hires at 12-months is too large to be just be new graduates entering the workforce; perhaps large IT employers have annual reviews for all employees at the same time every year, causing some people to quit and obtain new jobs (Quits has a slightly larger spike at 12-months). Why is there a regular 3-month cycle for Job Openings? The negative correlation in Layoffs at one & two months is explained by companies laying off a batch of workers one month, followed by layoffs in the following two months being lower than usual.
I don’t know much about employment practices, so I won’t speculate any more. Comments welcome.
Are there any interest cross-correlations between the pairs of time-series?
The plot below shows four pairs of cross correlations (code+data):

Hires & Layoffs shows a scattered pattern of Hires preceding Layoffs (to be expected), and the bottom left shows there is a pattern of Quits preceding Layoffs (are people searching for steadier employment when layoffs loom?). Top right shows a pattern of Job Openings following Hires (I’m clutching at straws for this; is Hires a proxy for Quits, the cross correlation of Job Openings & Quits does have Job Openings leading), the bottom right shows the pattern of Hires leading Quits.
Nothing in this analysis surprised me, but then it is rather basic and broad brush. These results are the start of an analysis of the IT employment ecosystem; one that probably won’t progress far because of a lack of data and interest on my part.
A new career in software development: advice for non-youngsters
Lately I have been encountering non-young people looking to switch careers, into software development. My suggestions have centered around the ageism culture and how they can take advantage of fashions in software ecosystems to improve their job prospects.
I start by telling them the good news: the demand for software developers outstrips supply, followed by the bad news that software development culture is ageist.
One consequence of the preponderance of the young is that people are heavily influenced by fads and fashions, which come and go over less than a decade.
The perception of technology progresses through the stages of fashionable, established and legacy (management-speak for unfashionable).
Non-youngsters can leverage the influence of fashion’s impact on job applicants by focusing on what is unfashionable, the more unfashionable the less likely that youngsters will apply, e.g., maintaining Cobol and Fortran code (both seriously unfashionable).
The benefits of applying to work with unfashionable technology include more than a smaller job applicant pool:
- new technology (fashion is about the new) often experiences a period of rapid change, and keeping up with change requires time and effort. Does somebody with a family, or outside interests, really want to spend time keeping up with constant change at work? I suspect not,
- systems depending on unfashionable technology have been around long enough to prove their worth, the sunk cost has been paid, and they will continue to be used until something a lot more cost-effective turns up, i.e., there is more job security compared to systems based on fashionable technology that has yet to prove their worth.
There is lots of unfashionable software technology out there. Software can be considered unfashionable simply because of the language in which it is written; some of the more well known of such languages include: Fortran, Cobol, Pascal, and Basic (in a multitude of forms), with less well known languages including, MUMPS, and almost any mainframe related language.
Unless you want to be competing for a job with hordes of keen/cheaper youngsters, don’t touch Rust, Go, or anything being touted as the latest language.
Databases also have a fashion status. The unfashionable include: dBase, Clarion, and a whole host of 4GL systems.
Be careful with any database that is NoSQL related, it may be fashionable or an established product being marketed using the latest buzzwords.
Testing and QA have always been very unsexy areas to work in. These areas provide the opportunity for the mature applicants to shine by highlighting their stability and reliability; what company would want to entrust some young kid with deciding whether the software is ready to be released to paying customers?
More suggestions for non-young people looking to get into software development welcome.
NoEstimates panders to mismanagement and developer insecurity
Why do so few software development teams regularly attempt to estimate the duration of the feature/task/functionality they are going to implement?
Developers hate giving estimates; estimating is very hard and estimates are often inaccurate (at a minimum making the estimator feel uncomfortable and worse when management treats an estimate as a quotation). The future is uncertain and estimating provides guidance.
Managers tell me that the fear of losing good developers dissuades them from requiring teams to make estimates. Developers have told them that they would leave a company that required them to regularly make estimates.
For most of the last 70 years, demand for software developers has outstripped supply. Consequently, management has to pay a lot more attention to the views of software developers than the views of those employed in most other roles (at least if they want to keep the good developers, i.e., those who will have no problem finding another job).
It is not difficult for developers to get a general idea of how their salary, working conditions and practices compares with other developers in their field/geographic region. They know that estimating is not a common practice, and unless the economy is in recession, finding a new job that does not require estimation could be straight forward.
Management’s demands for estimates has led to the creation of various methods for calculating proxy estimate values, none of which using time as the unit of measure, e.g., Function points and Story points. These methods break the requirements down into smaller units, and subcomponents from these units are used to calculate a value, e.g., the Function point calculation includes items such as number of user inputs and outputs, and number of files.
How accurate are these proxy values, compared to time estimates?
As always, software engineering data is sparse. One analysis of 149 projects found that  , with the variance being similar to that found when time was estimated. An analysis of Function point calculation data found a high degree of consistency in the calculations made by different people (various Function point organizations have certification schemes that require some degree of proficiency to pass).
Managers don’t seem to be interested in comparing estimated Story points against estimated time, preferring instead to track the rate at which Story points are implemented, e.g., velocity, or burndown. There are tiny amounts of data comparing Story points with time and Function points.
The available evidence suggests a relationship connecting Function points to actual time, and that Function points have similar error bounds to time estimates; the lack of data means that Story points are currently just a source of technobabble and number porn for management power-points (send me Story point data to help change this situation).
Burger flippers with STEM degrees
There continues to be a lot of fuss over the shortage of STEM staff (Science, technology, engineering, and mathematics). But analysis of the employment data suggests there is no STEM shortage.
One figure than jumps out is the unemployment rate for computing graduates, why is this rate of so consistently much higher than other STEM graduates, 12% vs. under 9% for the rest?
Based on my somewhat limited experience of sitting on industrial panels in university IT departments (the intended purpose of such panels is to provide industry input, but in practice we are there to rubber stamp what the department has already decided to do) and talking with recent graduates, I would explain the situation described above was follows:
The dynamics from the suppliers’ side (i.e., the Universities) is that students want a STEM degree, students are the customer (i.e., they are paying) and so the university had better provide degrees that the customer can pass (e.g., minimise the maths content and make having to learn how to program optional on computing courses). Students get a STEM degree, but those taking the ‘easy’ route are unemployable in STEM jobs.
There is not a shortage of people with STEM degrees, but there is a shortage of people with STEM degrees who can walk the talk.
Today’s burger flippers have STEM degrees that did not require students to do any serious maths or learn to program.
Recent Comments