Archive
Popularity of Open source Operating systems over time
Surveys of operating system usage trends are regularly published and we get to read about how the various Microsoft products are doing and the onward progress of mobile OSs; sometimes Linux gets an entry at the bottom of the list, sometimes it is just ‘others’ and sometimes it is both.
Operating systems are pervasive and a variety of groups actively track reported faults in order to issue warnings to the public; the volume of OS fault informations available makes it an obvious candidate for testing fault prediction models (e.g., how many faults will occur in a given period of time). A very interesting fault history analysis of OpenBSD in a paper by Ozment and Schechter recently caught my eye and I wondered if the fault time-line could be explained by the time-line of OpenBSD usage (e.g., more users more faults reported). While collecting OS usage information is not the primary goal for me I thought people would be interested in what I have found out and in particular to share the OS usage data I have managed to obtain.
How might operating system usage be measured? Analyzing web server logs is an obvious candidate method; when a web browser requests information many web servers write information about the request to a log file and this information sometimes includes the name of the operating system on which the browser is running.
Other sources of information include items sold (licenses in Microsoft’s case, CDs/DVD’s for Open source or perhaps books {but book sales tend not to be reported in the way programming language book sales are reported}) and job adverts.
For my time-line analysis I needed OpenBSD usage information between 1998 and 2005.
The best source of information I found, by far, of Open source OS usage derived from server logs (around 138 million Open source specific entries) is that provided by Distrowatch who count over 700 different distributions as far back as 2002. What is more Ladislav Bodnar the founder and executive editor of DistroWatch was happy to run a script I sent him to extract the count data I was interested in (I am not duplicating Distrowatch’s popularity lists here, just providing the 14 day totals for OS count data). Some analysis of this data below.
As luck would have it I recently read a paper by Diomidis Spinellis which had used server log data to estimate the adoption of Open Source within organizations. Diomidis researches Open source and was willing to run a script I wrote to extract the User Agent string from the 278 million records he had (unfortunately I cannot make this public because it might contain personal information such as email addresses, just the monthly totals for OS count data, tar file of all the scripts I used to process this raw log data; the script to try on your own logs is countos.sh).
My attempt to extract OS names from the list of User Agent strings Diomidis sent me (67% of of the original log entries did contain a User Agent string) provides some insight into the reliability of this approach to counting usage (getos.awk is the script to try on the strings extracted with the earlier script). There is no generally agreed standard for:
- what information should be present; 6% of UA strings contained no OS name that I knew (this excludes those entries that were obviously robots/crawlers/spiders/etc),
- the character string used to specify a given OS or a distribution; the only option is to match a known list of names (OS names used by Distrowatch,
missos.awkis the tar file script to print out any string not containing a specified list of OS names, the Wikipedia List of operating systems article), - quality assurance; some people cannot spell ‘windows’ correctly and even though the source is now available I don’t think anybody uses CP/M to access the web (at least 91 strings,
 %, would not have passed).
Ladislav Bodnar thinks that log entries from the same IP addresses should only be counted once per day per OS name. I agree that this approach is much better than ignoring address information; why should a person who makes 10 accesses be counted 10 times, a person who makes one access is only counted once. It is possible that two or more separate machines running the same OS are accessing the Internet through a common gateway that results in them having the IP address from an external server’s point of view; this possibility means that the Distrowatch data undercounts the unique accesses (not a serious problem if most visitors have direct Internet access rather than through a corporate network).
The Distrowatch data includes counts for all IP address and from 13 May 2004 onwards unique IP address per day per OS. The mean ratio between these two values, summed over all OS counts within 14 day periods, is 1.9 (standard deviation 0.08) and the Pearson correlation coefficient between them is 0.987 (95% confidence interval is 0.984 to 0.990), i.e., almost perfect correlation.
The Spinellis data ignores IP address information (I got this dataset first, and have already spent too much time collecting to do more data extraction) and has 10 million UA strings containing Open source OS names (6% of all OS names matched).
How representative are the Distrowatch and Spinellis data? The data is as representative of the general OS population as the visitors recorded in the respective server logs are representative of OS usage. The plot below shows the percentage of visitors to Distrowatch that use Ubuntu, Suse, Redhat. Why does Redhat, a very large company in the Open source world, have such a low percentage compared to Ubuntu? I imagine because Redhat customers get their updates from Redhat and don’t see a need to visit sites such as Distrowatch; a similar argument can be applied to Suse. Perhaps the Distrowatch data underestimates those distributions that have well known websites and users who have no interest in other distributions. I have not done much analysis of the Spinellis data.
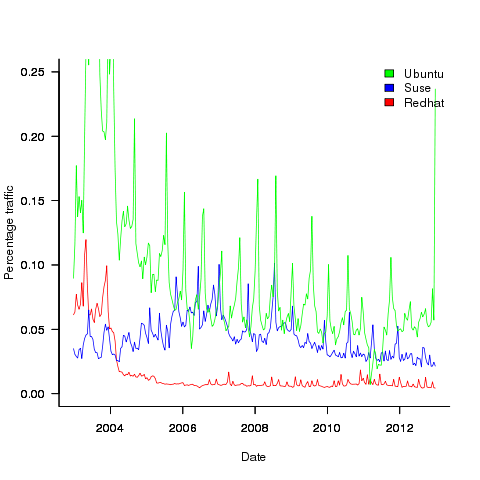
Presumably the spikes in usage occur around releases of new versions, I have not checked.
For my analysis I am interested in relative change over time, which means that representativeness and not knowing the absolute number of OSs in use is not a problem. Researchers interested in a representative sample or estimating the total number of OSs in use are going to need a wider selection of data; they might be interested in the following OS usage information I managed to find (yes I know about Netcraft, they charge money for detailed data and I have not checked what the Wayback Machine has on file):
- Wikimedia has OS count information back to 2009. Going forward this is a source of log data to rival Distrowatch’s, but the author of the scripts probably ought to update the list of OS names matched against,
- w3schools has good summary data for many months going back to 2003,
- statcounter has good summary data (daily, weekly, monthly) going back to 2008,
- TheCounter.com had data from 2000 to 2009 (csv file containing counts obtained from Wayback Machine).
If any reader has or knows anybody who has detailed OS usage data please consider sharing it with everybody.
Recent Comments