Archive
Median system cpu clock frequency over last 15 years
We are all familiar with graphs showing the growth of cpu clock frequency over time. The data for these plots is based on vendor announcements listing the characteristics of their latest products, and invariably focuses on the product which is the fastest or contains the most transistors or the lowest power consumption.
Some customers buy the cpu with the highest/most/lowest, but many are happy to pay less for, for good enough. What does a graph of average customer cpu clock frequency over time look like?
Vendors sometimes publish general sales figures, but I have never seen one broken down by clock frequency. However, a few sites collect user system data, including:
- A subset of the Linux Counter project data is available. This does not contain explicit date information, but a must-be-later-than date can be inferred from the listed Linux kernel version,
- Hardware for BSD has data going back to December 2014, but there is no obvious way to extract it (I have not tried that hard),
- the BSDstats project (variable website availability) has been collecting data on machines running some derivative of BSD since August 2008; it contains around 200 times more cpu data than the known Linux Counter data. While the raw data is not available, approximately monthly reports are available on the Wayback Machine.
A BSDstats cpu history was obtained using waybackpack to download the available stored cpu summary pages, followed by html2text, and an awk script to extract the cpu frequency/count data.
BSDstats obtains the cpu information via a call to the sysctl command. For many Intel processors, but not AMD processors, the returned string includes the frequency (to see your cpu information on Linux systems type: more /proc/cpu), for instance:
Celeron(R) CPU 2.80GHz | 336 Pentium(R) 4 CPU 3.00GHz | 258 Pentium(R) 4 CPU 2.40GHz | 170 Athlon(tm) 64 Processor 3000+ | 43 Athlon(tm) 64 X2 Dual Core Processor 4200+ | 28 Athlon(tm) 64 Processor 3500+ | 27 |
For simplicity, only those rows containing frequency information were used in this analysis; 67% of the strings explicitly included a frequency (this saved me having to build a table to map AMD cpu strings to their corresponding frequency).
The plot below shows median cpu frequency (in red), along with the top/bottom 10% cpu frequencies, based on the Wayback Machine’s copy of the webpage on a given date, for a total of 2,304,446 cpu identities (code+data):
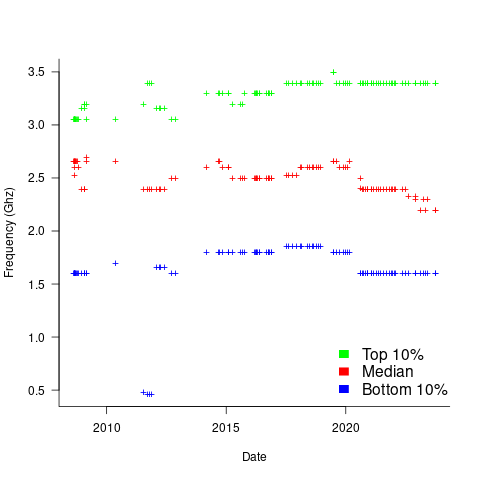
Broadly, the plot shows that cpu frequencies have essentially remained unchanged since 2008, with systems running BSD having a median frequency of 2.5 GHz, with 10% of systems having a frequency over 3.5 GHz, and 10% of systems a frequency below 1.5 GHz.
I was surprised at how many different frequencies were present in the data; often over 50. A look at the large number of different versions of Intel x86 cpus suggests that this is to be expected.
How representative is this sample of BSD systems, compared to the many more systems running Linux and Windows?
This begs the question of what kinds of environments are being compared. Are these desktop systems, local or hosted clusters, cloud systems?
The plot below shows the total number of cpus summarised on each Wayback Machine snapshot (code+data):

A few thousand systems are likely to be personal desktop systems, while the tens of thousands are likely to be clusters or small cloud providers.
Pointers to more data, particularly pre-2000, most welcome.
Cost-effectiveness decision for fixing a known coding mistake
If a mistake is spotted in the source code of a shipping software system, is it more cost-effective to fix the mistake, or to wait for a customer to report a fault whose root cause turns out to be that particular coding mistake?
The naive answer is don’t wait for a customer fault report, based on the following simplistic argument:  .
.
where:  is the cost of fixing the mistake in the code (including testing etc), and
  is the cost of finding the mistake in the code based on a customer fault report (i.e., the sum on the right is the total cost of fixing a fault reported by a customer).
If the mistake is spotted in the code for ‘free’, then  , e.g., a developer reading the code for another reason, or flagged by a static analysis tool.
This answer is naive because it fails to take into account the possibility that the code containing the mistake is deleted/modified before any customers experience a fault caused by the mistake; let  be the likelihood that the coding mistake ceases to exist in the next unit of time.
The more often the software is used, the more likely a fault experience based on the coding mistake occurs; let  be the likelihood that a fault is reported in the next time unit.
A more realistic analysis takes into account both the likelihood of the coding mistake disappearing and a corresponding fault being reported, modifying the relationship to: *{F_{experience}/M_{gone}}")
Software systems are eventually retired from service; the likelihood that the software is maintained during the next unit of time,  , is slightly less than one.
Giving the relationship: *{F_{experience}/M_{gone}}*S_{maintained}")
which simplifies to: *{F_{experience}/M_{gone}}*S_{maintained}")
What is the likely range of values for the ratio:  ?
?
I have no find/fix cost data, although detailed total time is available, i.e., find+fix time (with time probably being a good proxy for cost). My personal experience of find often taking a lot longer than fix probably suffers from survival of memorable cases; I can think of cases where the opposite was true.
The two values in the ratio  are likely to change as a system evolves, e.g., high code turnover during early releases that slows as the system matures. The value of should decrease over time, but increase with a large influx of new users.
A study by Penta, Cerulo and Aversano investigated the lifetime of coding mistakes (detected by several tools), tracking them over three years from creation to possible removal (either fixed because of a fault report, or simply a change to the code).
Of the 2,388 coding mistakes detected in code developed over 3-years, 41 were removed as reported faults and 416 disappeared through changes to the code: 
The plot below shows the survival curve for memory related coding mistakes detected in Samba, based on reported faults (red) and all other changes to the code (blue/green, code+data):
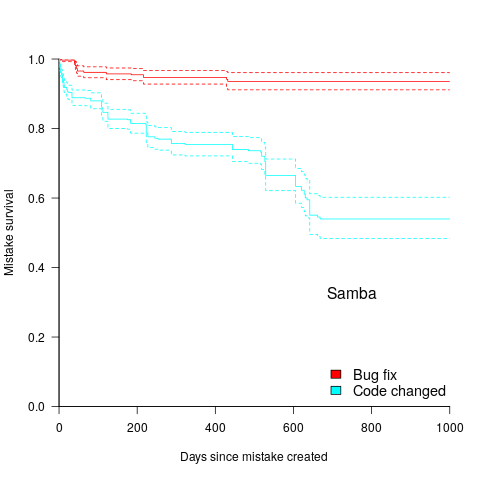
Coding mistakes are obviously being removed much more rapidly due to changes to the source, compared to customer fault reports.
For it to be cost-effective to fix coding mistakes in Samba, flagged by the tools used in this study ( is essentially one), requires:  .
.
Meeting this requirement does not look that implausible to me, but obviously data is needed.
Memory capacity growth: a major contributor to the success of computers
The growth in memory capacity is the unsung hero of the computer revolution. Intel’s multi-decade annual billion dollar marketing spend has ensured that cpu clock frequency dominates our attention (a lot of people don’t know that memory is available at different frequencies, and this can have a larger impact on performance that cpu frequency).
In many ways memory capacity is more important than clock frequency: a program won’t run unless enough memory is available but people can wait for a slow cpu.
The growth in memory capacity of customer computers changed the structure of the software business.
When memory capacity was limited by a 16-bit address space (i.e., 64k), commercially saleable applications could be created by one or two very capable developers working flat out for a year. There was no point hiring a large team, because the resulting application would be too large to run on a typical customer computer. Very large applications were written, but these were bespoke systems consisting of many small programs that ran one after the other.
Once the memory capacity of a typical customer computer started to regularly increase it became practical, and eventually necessary, to create and sell applications offering ever more functionality. A successful application written by one developer became rarer and rarer.
Microsoft Windows is the poster child application that grew in complexity as computer memory capacity grew. Microsoft’s MS-DOS had lots of potential competitors because it was small (it was created in an era when 64k was a lot of memory). In the 1990s the increasing memory capacity enabled Microsoft to create a moat around their products, by offering an increasingly wide variety of functionality that required a large team of developers to build and then support.
GCC’s rise to dominance was possible for the same reason as Microsoft Windows. In the late 1980s gcc was just another one-man compiler project, others could not make significant contributions because the resulting compiler would not run on a typical developer computer. Once memory capacity took off, it was possible for gcc to grow from the contributions of many, something that other one-man compilers could not do (without hiring lots of developers).
How fast did the memory capacity of computers owned by potential customers grow?
One source of information is the adverts in Byte (the magazine), lots of pdfs are available, and perhaps one day a student with some time will extract the information.
Wikipedia has plenty of articles detailing cpu performance, e.g., Macintosh models by cpu type (a comparison of Macintosh models does include memory capacity). The impact of Intel’s marketing dollars on the perception of computer systems is a PhD thesis waiting to be written.
The SPEC benchmarks have been around since 1988, recording system memory capacity since 1994, and SPEC make their detailed data public 🙂 Hardware vendors are more likely to submit SPEC results for their high-end systems, than their run-of-the-mill systems. However, if we are looking at rate of growth, rather than absolute memory capacity, the results may be representative of typical customer systems.
The plot below shows memory capacity against date of reported benchmarking (which I assume is close to the date a system first became available). The lines are fitted using quantile regression, with 95% of systems being above the lower line (i.e., these systems all have more memory than those below this line), and 50% are above the upper line (code+data):
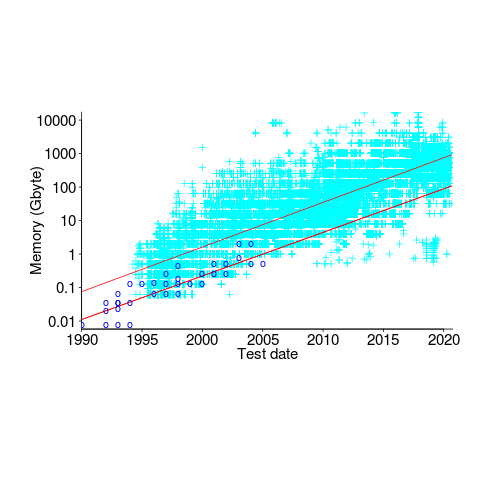
The fitted models show the memory capacity doubling every 845 or 825 days. The blue circles are memory that comes installed with various Macintosh systems, at time of launch (memory doubling time is 730 days).
How did applications’ minimum required memory grow over time? I have a patchy data for a smattering of products, extracted from Wikipedia. Some vendors probably required customers to have a fairly beefy machine, while others went for a wider customer base. Data on the memory requirements of the various versions of products launched in the 1990s is very hard to find. Pointers very welcome.
Unreliable cpus and memory: The end result of Moore’s law?
Where is the evolution of commodity cpu and memory chips going to take its customers? I think the answer is cheap and unreliable products (just like many household appliances are priced low and have a short expected lifetime).
We have had the manufacturer-customer win-win phase of Moore’s law and I think we are now entering the win-loose phase.
The reason chip manufacturers, such as Intel, invest so heavily on continually shrinking dies is the same reason all companies invest, they expect to get a good return on their investment. The cost of processing the wafer from which individual chips are cut is more or less constant, reducing the size of a chip enables more to fitted on the same wafer, giving more product to sell for more or less the same wafer processing cost.
The fact that dies with smaller feature sizes have reduce power consumption and can run at faster clock speeds (up until around 10 years ago) is a secondary benefit to manufacturers (it created a reason for customers to replace what they already owned with a newer product); chip manufacturers would still have gone down the die shrink path if these secondary benefits had not existed, but perhaps at a slower rate. Customers saw, or were marketed, this strinkage story as one of product improvement for their benefit rather than as one of unit cost reduction for Intel’s benefit (Intel is the end-customer facing company that pumped billions into marketing).
Until recently both manufacturer and customer have benefited from die shrinks through faster cpus/lower power consumption and lower unit cost.
A problem that was rarely encountered outside of science fiction a few decades ago is now regularly encountered by all owners of modern computers, cosmic rays (plus more local source of ‘rays’) altering the behavior of running programs (4 GB of RAM is likely to experience a single bit-flip once every 33 hours of operation). As die shrink continues this problem will get worse. Another problem with ever smaller transistors is their decreasing mean time to failure (very technical details); we have seen expected chip lifetimes drop from 10 years to 7 and now less and decreasing.
Decreasing chip lifetimes is actually good for the manufacturer, it creates a reason for customers to buy a new product. Buying a new computer every 2-3 years has been accepted practice for many years (because the new ones were much better). Are we, the customer, in danger of being led to continue with this ‘accepted practice’ (because computers reliability is poor)?
Surely it is to the customer’s advantage to not buy devices that contain chips with even smaller features? Is it only the manufacturer that will obtain a worthwhile benefit from future die shrinks?
Recent Comments