Archive
Census of general purpose computers installed in the 1960s
In the 1960s a small number of computer manufacturers sold a relatively small number of general purpose computers (IBM dominated the market). Between 1962 and 1974 the magazine Computers and Automation published a monthly census listing the total number of installed, and unfilled orders for, general purpose computers. A pdf of all the scanned census data is available on Bitsavers.
Over the last 10-years, I have made sporadic attempts to convert the data in this pdf to csv form. The available tools do a passable job of generating text, but the layout of the converted text is often very different from the visible layout presented by a pdf viewer. This difference is caused by the pdf2text tools outputting characters in the order in which they occur within the pdf. For example, if a pdf viewer shows the following text, with numbers showing the relative order of characters within the pdf file:
    1  2  6
    3     7
4 5 8 |
the output from pdf2text might be one of the four possibilities:
   1  2       1  2       1         1
   3          3          2         2
   4  5       4          3         3
   6          5          4  5      4
   7          6          6         5
   8          7          7         6
              8          8         7
8 |
One cause of the difference is the algorithm pdf2text uses to decide whether characters occur on the same line, i.e., do they have the same vertical position on the same page, measured in points ( inch, or ≈ 0.353 mm)?
When a pdf is created by an application, characters on the same visual line usually have the same vertical position, and the extracted output follows a regular pattern. It’s just a matter of moving characters to the appropriate columns (editor macros to the rescue). Missing table entries complicate the process.
The computer census data comes from scanned magazines, and the vertical positions of characters on the same visual line are every so slightly different. This vertical variation effectively causes pdf2text to output the discrete character sequences on a variety of different lines.
A more sophisticated line assignment algorithm is needed. For instance, given the x/y position of each discrete character sequence, a fuzzy matching algorithm could assign the most likely row and column to each sequence.
The mupdf tool has an option to generate html, and this html contains the page/row/column values for each discrete character sequence, and it is possible to use this information to form reasonably laid out text. Unfortunately, the text on the scanned pages is not crisply sharp and mupdf produces o instead of 0, and l not 1, on a regular basis; too often for me to be interested in manually correctly the output.
Tesseract is the ocr tool of choice for many, and it supports the output of bounding box information. Unfortunately, running this software regularly causes my Linux based desktop to reboot.
I recently learned about Amazon’s Textract service, and tried it out. The results were impressive. Textract doesn’t just map characters to their position on the visible page, it is capable of joining multiple rows within a column and will insert empty strings if a column/row does not contain any characters. For instance, in the following image of the top of a page:
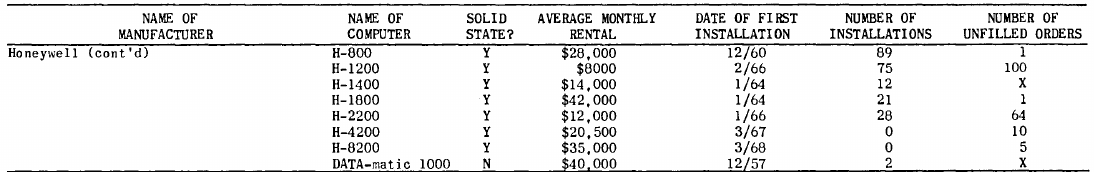
the column names are converted to "NAME OF MANUFACTURER","NAME OF COMPUTER", etc., and the empty first column/row are mapped to "".
The conversion is not quiet 100% accurate, but then the input is not 100% accurate; a few black smudges are treated as a single-quote or decimal point, and comma is sometimes treated as a fullstop. There were around 20 such mistakes in 11,000+ rows of numbers/names. There were six instances where two lines were merged into a single row, when the lines should have each been a separate row.
Having an essentially accurate conversion to csv available, does not remove the need for data cleaning. The image above contains two examples of entries that need to be corrected: the first column specifies that it is a continuation of a column on the previous page (over 12 different abbreviated forms of continued are used) Honeywell (cont'd) -> Honeywell, and other pages use a slightly different name for a particular computer DATA-matic 1000 -> Datamatic 1000. There are 350+ cleaning edits in my awk script that catch most issues (code+data).
How useful is this data?
Early computer census data in csv form is very rare, and now lots of it is available. My immediate use is completing a long-standing dataset conversion.
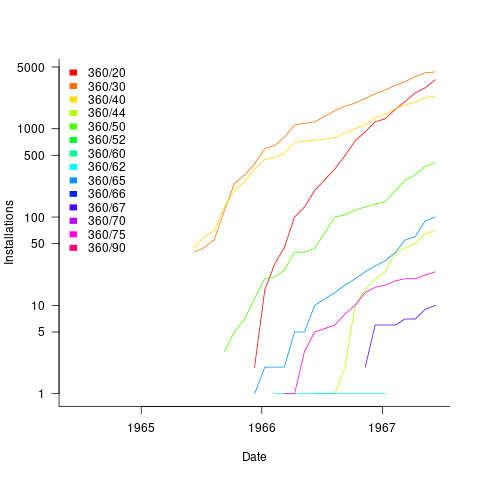
Obtaining the level of detail in this census, on a monthly basis, requires some degree of cooperation from the manufacturer. June 1967 appears to be the last time that IBM supplied detailed information, and later IBM census entries are listed as round estimates (and only for a few models).
The plot below shows the growth in the number of IBM 360 installations, for various models (unfilled orders date back to May 1964; code+data):
What software engineering data have I collected on subject X?
While it’s great that so much data was uncovered during the writing of the Evidence-based software engineering book, trying to locate data on a particular topic can be convoluted (not least because there might not be any). There are three sources of information about the data:
- the paper(s) written by the researchers who collected the data,
- my analysis and/or discussion of the data (which is frequently different from the original researchers),
- the column names in the csv file, i.e., data is often available which neither the researchers nor I discuss.
At the beginning I expected there to be at most a few hundred datasets; easy enough to remember what they are about. While searching for some data, one day, I realised that relying on memory was not a good idea (it was never a good idea), and started including data identification tags in every R file (of which there are currently 980+). This week has been spent improving tag consistency and generally tidying them up.
How might data identification information be extracted from the paper that was the original source of the data (other than reading the paper)?
Named-entity recognition, NER, is a possible starting point; after all, the data has names associated with it.
Tools are available for extracting text from pdf file, and 10-lines of Python later we have a list of named entities:
import spacy # Load English tokenizer, tagger, parser, NER and word vectors nlp = spacy.load("en_core_web_sm") file_name = 'eseur.txt' soft_eng_text = open(file_name).read() soft_eng_doc = nlp(soft_eng_text) for ent in soft_eng_doc.ents: print(ent.text, ent.start_char, ent.end_char, ent.label_, spacy.explain(ent.label_)) |
The catch is that en_core_web_sm is a general model for English, and is not software engineering specific, i.e., the returned named entities are not that good (from a software perspective).
An application domain language model is likely to perform much better than a general English model. While there are some application domain models available for spaCy (e.g., biochemistry), and application datasets, I could not find any spaCy models for software engineering (I did find an interesting word2vec model trained on Stackoverflow posts, which would be great for comparing documents, but not what I was after).
While it’s easy to train a spaCy NER model, the time-consuming bit is collecting and cleaning the text needed. I have plenty of other things to keep me busy. But this would be a great project for somebody wanting to learn spaCy and natural language processing 🙂
What information is contained in the undiscussed data columns? Or, from the practical point of view, what information can be extracted from these columns without too much effort?
The number of columns in a csv file is an indicator of the number of different kinds of information that might be present. If a csv is used in the analysis of X, and it contains lots of columns (say more than half-a-dozen), then it might be assumed that it contains more data relating to X.
Column names are not always suggestive of the information they contain, but might be of some use.
Many of the csv files contain just a few rows/columns. A list of csv files that contain lots of data would narrow down the search, at least for those looking for lots of data.
Another possibility is to group csv files by potential use of data, e.g., estimating, benchmarking, testing, etc.
More data is going to become available, and grouping by potential use has the advantage that it is easier to track the availability of new data that may supersede older data (that may contain few entries or apply to circumstances that no longer exist)
My current techniques for locating data on a given subject is either remembering the shape of a particular plot (and trying to find it), or using the pdf reader’s search function to locate likely words and phrases (and then look at the plots and citations).
Suggestions for searching or labelling the data, that don’t require lots of effort, welcome.
Converting graphs in pdf files to csv format
Looking at a graph displayed as part of a pdf document is so tantalizing; I want that data as a csv!
One way to get the data is to email the author(s) and ask for it. I do this regularly and sometimes get the apologetic reply that the data is confidential. But I can see the data! Yes, but we only got permission to distribute the paper. I understand their position and would give the same reply myself; when given access to a company’s confidential data, explicit permission is often given about what can and cannot be made public with lists of numbers being on the cannot list.
The Portable Document Format was designed to be device independent, which means it contains a description of what to display rather than a bit-map of pixels (ok, it can contain a bit-map of pixels (e.g., a photograph) but this rather defeats the purpose of using pdf). It ought to be possible to automatically extract the data points from a graph and doing this has been on my list of things to do for a while.
I was mooching around the internals of a pdf last night when I spotted the line: /Producer (R 2.8.1); the authors had used R to generate the graphs and I could look at the R source code to figure out what was going on :-). I suspected that each line of the form: /F1 1 Tf 1 Tr 6.21 0 0 6.21 135.35 423.79 Tm (l) Tj 0 Tr was a description of a circle on the page and the function PDF_Circle in the file src/library/grDevices/src/devPS.c told me what the numbers meant; I was in business!
I also managed to match up other lines in the pdf file to the output produced by the functions PDF_Line and PDFSimpleText; it looked like the circles were followed by the axis tick marks and the label on each tick mark. Could things get any easier?
In suck-it-and-see projects like this it is best to use very familiar tools, this allows cognition to be focused on the task at hand. For me this meant using awk to match lines in pdf files and print out the required information.
Running the pdf through an awk script produced what looked like sensible x/y coordinates for circles on the page, the stop/start end-points of lines and text labels with their x/y coordinates. Now I needed to map the page x/y coordinates to within graph coordinate points.
After the circle coordinates in the output from the script were a series of descriptions of very short lines which looked like axis tick marks to me, especially since they were followed by coordinates of numbers that matched what appeared in the pdf graphs. This information is all that is needed to map from page coordinates to within graph coordinates. The graph I was interested in (figure 6) used logarithmic axis, so things were made a bit complicated by the need to perform a log transform.
Running the output (after some cut and pasting to removed stuff associated with other graphs in the pdf) from the first script through another awk script produced a csv file that could be fed into R’s plot to produce a graph that looked just like the original!
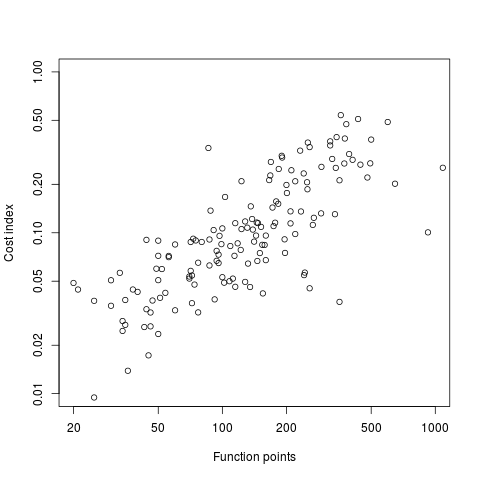
I would say it is possible to extract the data points from any graph, generated using R producing pdf or ps, contained within a pdf file.
The current scripts are very specific to the figure I was interested in, this is more to do with my rough and ready approach to solving the problem which makes assumptions about that is in the data; a more sophisticated version could handle common variations on the theme and with a bit of elbow grease point-and-click might be made to work.
It is probably also possible to extract data points in graphs produced by other tools, ‘all’ that is needed is information on the encoding used.
Extracting data from graphs generated to an image format such as png or jpg are going to need image processing software such as that used to extract data from images of tables.
O Cobol, Cobol! wherefore art thou Cobol?
Programming language popularity has been in the news again and as always Cobol is nowhere to be seen in the rankings. Even back in the day, when people in the know generally considered Cobol to be the most widely used language it often failed to appear, or appeared very low down, in language rankings. I think Cobol’s unrepresentative rankings occur because users of Cobol are assumed to hang out in the same places as users of other programming languages. The letters bo in the name is the clue, business oriented people are not usually interested in technical stuff and tend not to read the magazines (and these days web sites) that users of the other popular languages read.
Cobol is very business domain specific and does not contain functionality that makes it a reasonable choice for writing applications in other domains (it is possible to write a compiler in Cobol, for instance the Micro Focus compiler is written in Cobol). It has very sophisticated languages constructs for handling data having the most convoluted formats imaginable, essential in the business world which has to process data whose format has evolved over the years into a tangled mess (developers have to deal with spaghetti code, business has to deal with spaghetti data formats). Cobol’s control flow and code structuring facilities are primitive (all variables are global and the perform statement is very similar to the gosub statement found in Basic’s that are line number based) because business data processing tends to be relatively simple and programs to handle them are generally small (the large Cobol programs of legend are invariably made up of lots of small programs run in series with complicated data format dependencies between them).
I started to realise just how different Cobol is when working on my first Cobol code generator (yes it was written in Cobol). If a processor has lots of registers it is usually worthwhile to dedicate one to holding the value zero (of the 32 registers supported by most RISC processors, often only 31 can hold different values, one is dedicated to returning zero when read from and ignores any value written to it), in the case of Cobol it is considered worthwhile to dedicate a register to hold 0x20202020 (four space characters) rather than zero.
Is Cobol still the most widely used language today? No, I don’t think so. Business people love spreadsheets which means developers have switched to writing pre/post data format processing code, previously in Cobol, in Visual Basic (to convert input data into a form accepted by the spreadsheet and then print the results of the spreadsheet calculations in a presentable format); this Visual Basic source can often have a Cobol-like feel to it. This spreadsheet usage also resulted in the comma separated list becoming a widely used format for data representation, eroding Cobol’s unique selling point of sophisticated input/output data format processing.
What does language popularity mean? Does using a language you don’t like count towards it being popular? There are several languages I like and very rarely get to use, does this mean I don’t get to contribute to their popularity?
In these tough financial times the number of job adverts requiring knowledge of a specified language is probably of more interest than number of posts to web sites. One job search site lists 3,032 Cobol jobs and counting job ad hits for the top languages listed in a recent popularity poll puts Cobol at the bottom end of the cluster of highest ranked languages.
On mainframes I think Cobol is likely to still be No. 1; it is probably impossible to replace the dominant language in a niche market.
Recent Comments