Archive
Accuracy of Function Point estimates
The number of Function points, FP, contained in the implementation of a software system are counted by following a specified counting process. The number of FP counted for a project is mapped to a cost estimate by multiplying the number of FP by the predetermined cost value of one FP; the predetermined value is based on cost data from similar previous projects within the company. The FP process is so popular as a unit of cost estimation that there are six different ISO standards specifying six different Function point measurement processes.
TL;DR: Estimated cost is not as accurate as traditional time based estimating, although the estimation process may produce consistent FP counts.
The FP certification schemes run by various organizations require applicants to pass exams that check they are consistently following the specified processes to produce consistent FP counts, i.e., that certified practitioners give very similar answers for the same implementation problem. Experiments where subjects used different counting processes to count FP for the same task, have found what looks like a linear relationship between various pairs of FP counting processes.
Having certified FP employees/consultants produce similar counts is all well and good, but what management actually wants is a close correspondence between estimated and actual costs. What does the available data show with regard to FP cost estimation accuracy?
I know of two FP/Cost datasets, one containing 149 points from one company (actual costs have been normalised), and the other 492 points from three companies (actual costs in Euros; FP used is IFPUG); this dataset also includes additional context information and is used in this post’s analysis.
What is the relationship between an estimate based on FP and actual cost? The plot below show FP against actual cost, the red line is the fitted regression equation  , the grey line shows
  (code+data):
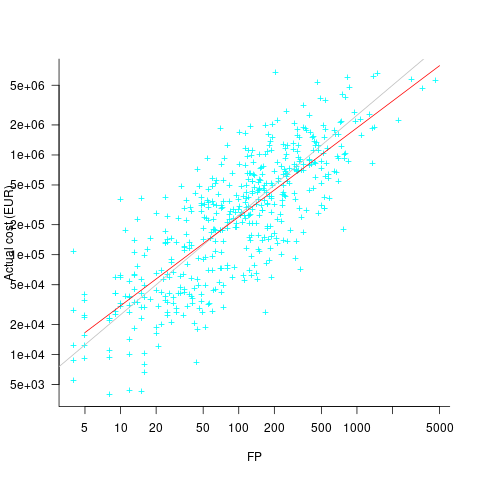
The power law exponent, 0.8, is slightly smaller than the 0.85 value found when fitting time estimates to actual times.
The dataset includes information specifying: anonymous organization ID, development method (78.5% plan driven and 21.5% Scrum), business domain (e.g., Call center, Mortgages, Front office), and various 0/1 flags each denoting a particular characteristic.
Including this information in a regression model finds that some of them have an impact on the FP to actual cost mapping. This is not surprising, since the FP/cost mapping is intended to be based on similar previous projects. The fitted model has the form:

where:  ,
,  ,
,  , and
, and  are constants for the corresponding items from the fitted regression model.
The fitted value for the scrum the development method is  , and
, and  for plan based (i.e., waterfall), i.e., Agile FP are cheaper than Waterfall FP. The idea of using both FP and scrum had not crossed my mind. Estimating via FP requires a detailed breakdown of the work to be done, while scrum is a process that discovers the work to be done. Perhaps a scrum like methodology was used to implement the detailed breakdown used to count FPs. The apparent lower cost of scrum FPs could just be a result of discovering that some planned functionality was not required.
How accurate were the FP estimates?
It is not possible to answer this question between we don’t know the cost assigned to one FP; in the above plot, the grey lines shows  .
.
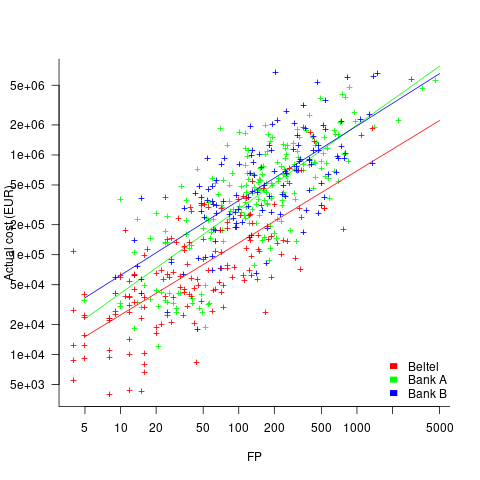
We can calculate an estimate accuracy relative to the fitted model (the red line above). The mapping from FP to cost can vary between organizations, and the following analysis is based on the data for each distinct organization. The plot below shows the points, and associated fitted regression line, for the three organizations (code+data):
Each organization’s fitted regression model can be used to calculate confidence intervals. Approximately 68% of FP estimates could be off by over a factor two (between 2.3 and 2.5) from the mean actual cost, while for the 95% interval FP estimates could be off by over a factor five (it varied between 5.0 and 5.8); code+data. The corresponding factors for traditional developer time estimation are two and four.
The exponent varies between 0.72 and 0.84, with Beltel and Bank B having very similar values (the exponent for time estimates is often close to 0.85). The FP/Cost mapping is likely to be similar for the two banks, but lower for the telecoms company.
Does slicing the data by organization and business domain reduce the width of the confidence intervals, i.e., smaller multiplication factor? In some cases the width is reduced, but in other cases the width is increased; the 68% factor is between 1.9 and 3.1, the 95% factor is between 3.2 and 9.4.
Analysis of Cost Performance Index for 338 projects
Project are estimated using a variety of resources. For those working at the sharp end, time is the pervasive resource. From the business perspective, the primary resource focus is on money; spending money to develop software that will make/save money.
Cost estimation data is much rarer than time estimation data (which itself is very thin on the ground).
The paper “An empirical study on a single company’s cost estimations of 338 software projects” (no public pdf currently available) by Christian Schürhoff, Stefan Hanenberg (who kindly sent me a copy of the data), and Volker Gruhn immediately caught my attention. What I am calling the Adesso dataset contains 4,713 rows relating to 338 fixed-price software projects implemented by Adesso SE (a German software and consulting company) between 2011 and the middle of 2016.
Cost estimation data is so very rare because of its commercial sensitivity. This paper deals with the commercial sensitivity issue by not releasing actual cost data, but by releasing data on a ratio of costs; the Cost Performance Index (CPI):

where:  are the actual costs (i.e., money spent) up to the current time, and
  is the earned value (a marketing term for the costs estimated for the planned work that has actually been completed up to the current time).
if  , then more was spent than estimated (i.e., project is behind schedule or was underestimated), while if
  , then less was spent than estimated (i.e., project is ahead of schedule or was overestimated).
The progress of a project’s implementation, in monetary terms, can be tracked by regularly measuring its CPI.
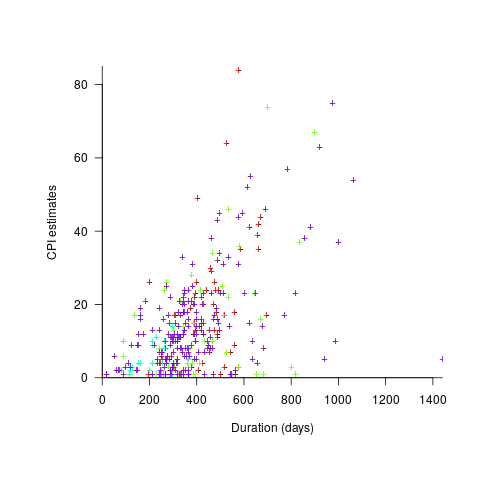
The Adesso dataset lists final values for each project (number of days being the most interesting), and each project’s CPI at various percent completed points. The plot below shows the number of CPI estimates for each project, against project duration; the assigned project numbers clustered into four bands and four colors are used to show projects in each band (code+data):
Presumably, projects that made only a handful of CPI estimates used other metrics to monitor project progress.
What are the patterns of change in a project’s CPI during its implementation? The plot below shows every CPI for each of 15 projects, with at least 44 CPI estimates, during implementation (code+data):
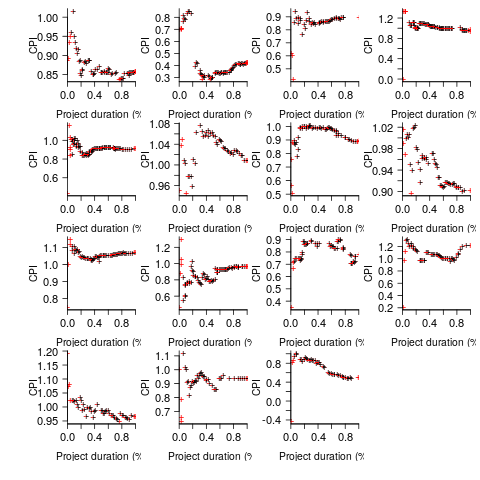
A commonly occurring theme, that will be familiar to those who have worked on projects, is that large changes usually occur at the start of the project, and then things settle down.
To continue as a going concern, a commercial company needs to make a profit. Underestimating a project may result in its implementation losing money. Losing money on some projects is not a problem, provided that the loses are cancelled out by overestimated projects making more money than planned.
While the mean CPI for the Adesso projects is 1.02 (standard deviation of 0.3), projects vary in size (and therefore costs). The data does not include project man-hours, but it does include project duration. The weighted mean, using duration as a proxy for man-hours, is 0.96 (standard deviation 0.3).
Companies cannot have long sequences of underestimated projects, creditors and shareholders will eventually call a halt. The Adesso dataset does not include any date information, so it is not possible to estimate the average CPI over shorter durations, e.g., one year.
I don’t have any practical experience of tracking project progress using earned value or CPI, and have only read theory papers on the subject (many essentially say that earned value is a great metric and everybody ought to be using it). Tips and suggestions welcome.
The fuzzy line between reworking and enhancing
One trick academics use to increase their publication count is to publish very similar papers in different conferences/journals; they essentially plagiarize themselves. This practice is frowned upon, but unless referees spot the ‘duplication’, it is difficult to prevent such plagiarized versions being published. Sometimes the knock-off paper will include additional authors and may not include some of the original authors.
How do people feel about independent authors publishing a paper where all the interesting material was derived from someone else’s paper, i.e., no joint authors? I have just encountered such a case in empirical software engineering.
“Software Cost Estimation: Present and Future” by Siba N. Mohanty from 1981 (cannot find a non-paywall pdf via Google; must exist because I have a copy) has been reworked to create “Cost Estimation: A Survey of Well-known Historic Cost Estimation Techniques” by Syed Ali Abbas and Xiaofeng Liao and Aqeel Ur Rehman and Afshan Azam and M. I. Abdullah (published in 2012; pdf here); they cite Mohanty as the source of their data, some thought has obviously gone into the reworked material and I found it useful and there is a discussion on techniques created since 1981.
What makes the 2012 stand out as interesting is the depth of analysis of the 1970s models and the data, all derived from the 1981 paper. The analysis of later models is not as interesting and doe snot include any data.
The 2012 paper did ring a few alarm bells (which rang a lot more loudly after I read the 1981 paper):
- Why was such a well researched and interesting paper published in such an obscure (at least to me) journal? I have encountered such cases before and had email conversations with the author(s). The well-known journals have not always been friendly towards empirical research, so an empirical paper appearing in less than a stellar publication is not unusual.
As regular readers will know I am always on the look-out for software engineering data and am willing to look far and wide. I judge a paper by its content, not the journal it was published in
- Why, in 2012, were researchers comparing effort estimation models proposed in the 1970s? Well, I am, so why not others? It did seem odd that I could not track down papers on some of the models cited, perhaps the pdfs had disappeared since 2012??? I think I just wanted to believe others were interested in what I was interested in.
What now? Retraction watch offers some advice.
The Journal of Emerging Trends in Computing and Information Sciences has an ethics page, I will email them a link to this post and see what happens (the article in question is listed as their second most cited article last year, with 19 citations).
Recent Comments