Archive
Average lines added/deleted by commits across languages
Are programs written in some programming language shorter/longer, on average, than when written in other languages?
There is a lot of variation in the length of the same program written in the same language, across different developers. Comparing program length across different languages requires a large sample of programs, each implemented in different languages, and by many different developers. This sounds like a fantasy sample, given the rarity of finding the same specification implemented multiple times in the same language.
There is a possible alternative approach to answering this question: Compare the size of commits, in lines of code, for many different programs across a variety of languages. The paper: A Study of Bug Resolution Characteristics in Popular Programming Languages by Zhang, Li, Hao, Wang, Tang, Zhang, and Harman studied 3,232,937 commits across 585 projects and 10 programming languages (between 56 and 60 projects per language, with between 58,533 and 474,497 commits per language).
The data on each commit includes: lines added, lines deleted, files changed, language, project, type of commit, lines of code in project (at some point in time). The paper investigate bug resolution characteristics, but does not include any data on number of people available to fix reported issues; I focused on all lines added/deleted.
Different projects (programs) will have different characteristics. For instance, a smaller program provides more scope for adding lots of new functionality, and a larger program contains more code that can be deleted. Some projects/developers commit every change (i.e., many small commit), while others only commit when the change is completed (i.e., larger commits). There may also be algorithmic characteristics that affect the quantity of code written, e.g., availability of libraries or need for detailed bit twiddling.
It is not possible to include project-id directly in the model, because each project is written in a different language, i.e., language can be predicted from project-id. However, program size can be included as a continuous variable (only one LOC value is available, which is not ideal).
The following R code fits a basic model (the number of lines added/deleted is count data and usually small, so a Poisson distribution is assumed; given the wide range of commit sizes, quantile regression may be a better approach):
alang_mod=glm(additions ~ language+log(LOC), data=lc, family="poisson") dlang_mod=glm(deletions ~ language+log(LOC), data=lc, family="poisson") |
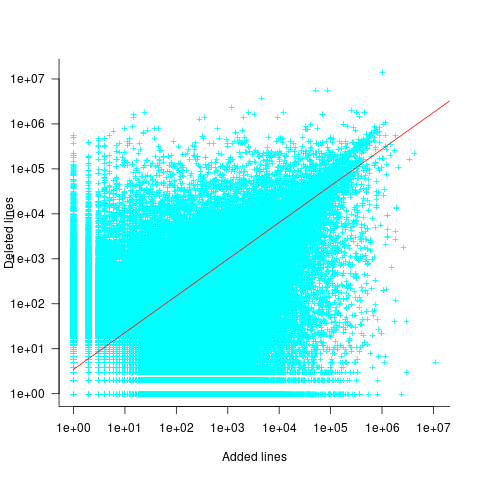
Some of the commits involve tens of thousands of lines (see plot below). This sounds rather extreme. So two sets of models are fitted, one with the original data and the other only including commits with additions/deletions containing less than 10,000 lines.
These models fit the mean number of lines added/deleted over all projects written in a particular language, and the models are multiplicative. As expected, the variance explained by these two factors is small, at around 5%. The two models fitted are (code+data):
 or
or  , and
, and  or
or  , where the value of
  is listed in the following table, and
  is the number of lines of code in the project:
                    Original          0 < lines < 10000
    Language     Added     Deleted     Added   Deleted
    C              1.0       1.0         1.0     1.0
    C#             1.7       1.6         1.5     1.5
    C++            1.9       2.1         1.3     1.4
    Go             1.4       1.2         1.3     1.2
    Java           0.9       1.0         1.5     1.5
    Javascript     1.1       1.1         1.3     1.6
    Objective-C    1.2       1.4         2.0     2.4
    PHP            2.5       2.6         1.7     1.9
    Python         0.7       0.7         0.8     0.8
Ruby 0.3 0.3 0.7 0.7 |
These fitted models suggest that commit addition/deletion both increase as project size increases, by around  , and that, for instance, a commit in Go adds 1.4 times as many lines as C, and delete 1.2 as many lines (averaged over all commits). Comparing adds/deletes for the same language: on average, a Go commit adds
  lines, and deletes
  lines.
There is a strong connection between the number of lines added/deleted in each commit. The plot below shows the lines added/deleted by each commit, with the red line showing a fitted regression model  (code+data):
What other information can be included in a model? It is possible that project specific behavior(s) create a correlation between the size of commits; the algorithm used to fit this model assumes zero correlation. The glmer function, in the R package lme4, can take account of correlation between commits. The model component (language | project) in the following code adds project as a random effect on the language variable:
del_lmod=glmer(deletions ~ language+log(LOC)+(language | project), data=lc_loc, family=poisson) |
It takes around 24hr of cpu time to fit this model, which means I have not done much experimentation…
Predicting the size of the Linux kernel binary
How big is the binary for the Linux kernel? Depending on the value of around 15,000 configuration options, the size of the version 5.8 binary could be anywhere between 7.3Mb and 2,134 Mb.
Who is interested in the size of the Linux kernel binary?
We are not in the early 1980s, when memory for a desktop microcomputer often topped out at 64K, and software was distributed on 360K floppies (720K when double density arrived; my companies first product was a code optimizer which reduced program size by around 10%).
While desktop systems usually have oodles of memory (disk and RAM), developers targeting embedded systems seek to reduce costs by minimizing storage requirements, security conscious organizations want to minimise the attack surface of the programs they run, and performance critical systems might want a kernel that fits within a processors’ L2/L3 cache.
When management want to maximise the functionality supported by a kernel within given hardware resource constraints, somebody gets the job of building kernels supporting various functionality to find out the size of the binaries.
At around 4+ minutes per kernel build, it’s going to take a lot of time (or cloud costs) to compare lots of options.
The paper Transfer Learning Across Variants and Versions: The Case of Linux Kernel Size by Martin, Acher, Pereira, Lesoil, Jézéquel, and Khelladi describes an attempt to build a predictive model for the size of the kernel binary. This paper includes an extensive list of references.
The author’s approach was to first obtain lots of kernel binary sizes by building lots of kernels using random permutations of on/off options (only on/off options were changed). Seven kernel versions between 4.13 and 5.8 were used, producing 243,323 size/option setting combinations (complete dataset). This data was used to train a machine learning model.
The accuracy of the predictions made by models trained on a single kernel version were accurate within that kernel version, but the accuracy of single version trained models dropped dramatically when used to predict the binary size of later kernel versions, e.g., a model trained on 4.13 had an accuracy of 5% MAPE predicting 4.13, when predicting 4.15 the accuracy is 20%, and 32% accurate predicting 5.7.
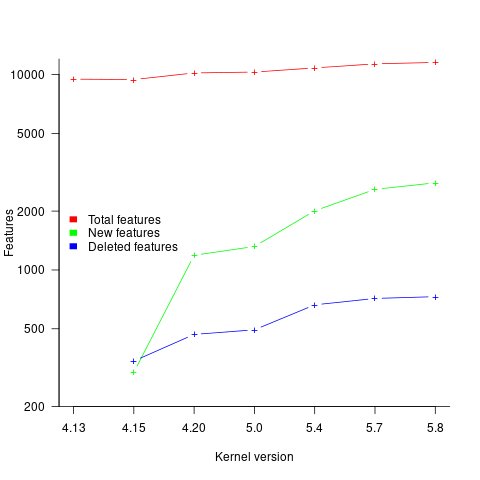
I think that the authors’ attempt to use this data to build a model that is accurate across versions is doomed to failure. The rate of change of kernel features (whose conditional compilation is supported by one or more build options) supported by Linux is too high to be accurately modelled based purely on information of past binary sizes/options. The plot below shows the total number of features, newly added, and deleted features in the modelled version of the kernel (code+data):
What is the range of impacts of each build option, on binary size?
If each build option is independent of the others (around 44% of conditional compilation directives in the kernel source contain one option), then the fitted coefficients of a simple regression model gives the build size increment when the corresponding option is enabled. After several cpu hours, the 92,562 builds involving 9,469 options in the version 4.13 build data were fitted. The plot below shows a sorted list of the size contribution of each option; the model  is 0.72, i.e., quite a good fit (code+data):

While the mean size increment for an enabled option is 75K, around 40% of enabled options decreases the size of the kernel binary. Modelling pairs of options (around 38% of conditional compilation directives in the kernel source contain two options) will have some impact on the pattern of behavior seen in the plot, but given the quality of the current model ( is 0.72) the change is unlikely to be dramatic. However, the simplistic approach of regression fitting the 90 million pairs of option interactions is not practical.
What might be a practical way of estimating binary size for any kernel version?
The size of a binary is essentially the quantity of code+static data it contains.
An estimate of the quantity of conditionally compiled source code dependent on a given option is likely to be a good proxy for that option’s incremental impact on binary size.
It’s trivial to scan source code for occurrences of options in conditional compilation directives, and with a bit more work, the number of lines controlled by the directive can be counted.
There has been a lot of evidence-based research on software product lines, and feature macros in particular. I was expecting to find a dataset listing the amount of code controlled by build options in Linux, but the data I can find does not measure Linux.
The Martin et al. build data is perfectfor creating a model linking quantity of conditionally compiled source code to change of binary size.
How are C functions different from Java methods?
According to the right plot below, most of the code in a C program resides in functions containing between 5-25 lines, while most of the code in Java programs resides in methods containing one line (code+data; data kindly supplied by Davy Landman):
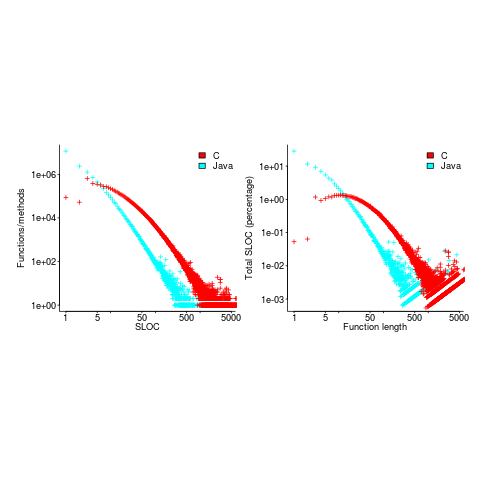
The left plot shows the number of functions/methods containing a given number of lines, the right plot shows the total number of lines (as a percentage of all lines measured) contained in functions/methods of a given length (6.3 million functions and 17.6 million methods).
Perhaps all those 1-line Java methods are really complicated. In C, most lines contain a few tokens, as seen below (code+data):
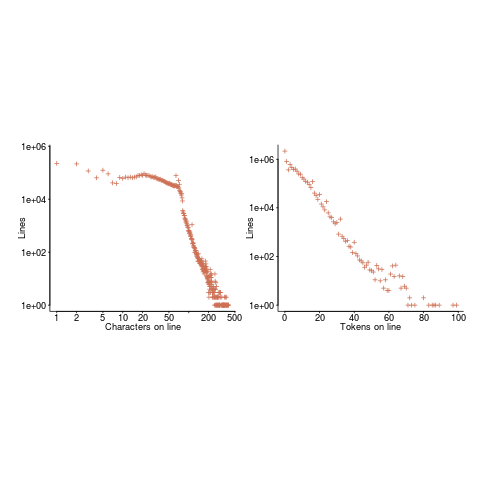
I don’t have any characters/tokens per line data for Java.
Is Java code mostly getters and setters?
I wonder what pattern C++ will follow, i.e., C-like, Java-like, or something else? If you have data for other languages, please send me a copy.
Changes in the API/non-API method call ratio with program size
Amount of code is the fundamental metric of software engineering. How do things change as the amount of code changes and often just as interestingly what does not change with code size?
Most languages include some kind of base library functionality. Languages such as Java and C++ not only include a very large library but also a huge, widely used, collection of third-party libraries.
Let’s count every method call in lots of Java programs and for each program divide these calls into two groups, calls to methods in well-known libraries (call these the API methods) and all other method calls (i.e., calls to methods written by the developers who wrote each of the programs measured; call these the non-API methods).
I would expect the ratio of API to non-API method calls to be independent of program size.
Yes, the number of possible different API calls is fixed while the number of possible non-API calls increases with program size, but I don’t see why a changing ratio of unique calls should change the ratio of total calls.
Yes, larger programs are likely to contain more architectural stuff whose code is more likely to contain calls to non-API methods, but the percentage of architectural code is very small and unlikely to have much impact on the overall numbers.
The authors of the paper: Large-scale, AST-based API-usage analysis of open-source Java projects made their data available and so I got to check out my thinking 🙂
The plot below shows everything going to plan until around 10,000 method calls (about 50,000 lines of code). Why that sudden kink in the line (code and data)?
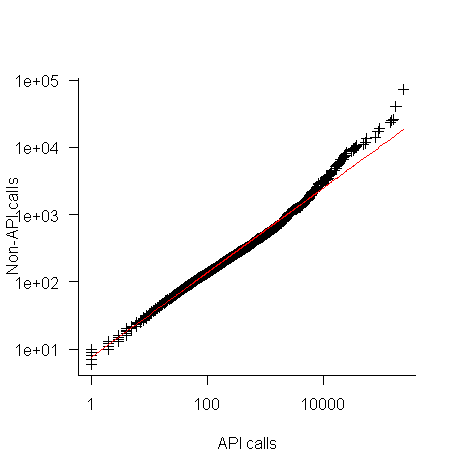
One possibility is that once a program gets to a size of around 50,000 lines the developers decide to invest in one or more wrapper packages which create a purpose built interface to an API (programs often have their own requirements and needs that existing an existing API interface does not quite meet); this would cause API calls to decrease and non-API calls to increase. If this pattern of usage occurred there would be a permanent change in the API/non-API ratio, and in practice the ratio change appears to be temporary.
I’m a bit stumped by this behavior. Suggestions on possible mechanisms welcome.
I wish I had the time to investigate, but I have a book to finish.
Recent Comments