Archive
Impact of number of files on number of review comments
Code review is often discussed from the perspective of changes to a single file. In practice, code review often involves multiple files (or at least pull-based reviews do), which begs the question: Do people invest less effort reviewing files appearing later?
TLDR: The number of review comments decreases for successive files in the pull request; by around 16% per file.
The paper First Come First Served: The Impact of File Position on Code Review extracted and analysed 219,476 pull requests from 138 Java projects on Github. They also ran an experiment which asked subjects to review two files, each containing a seeded coding mistake. The paper is relatively short and omits a lot of details; I’m guessing this is due to the page limit of a conference paper.
The plot below shows the number of pull requests containing a given number of files. The colored lines indicate the total number of code review comments associated with a given pull request, with the red dots showing the 69% of pull requests that did not receive any review comments (code+data):
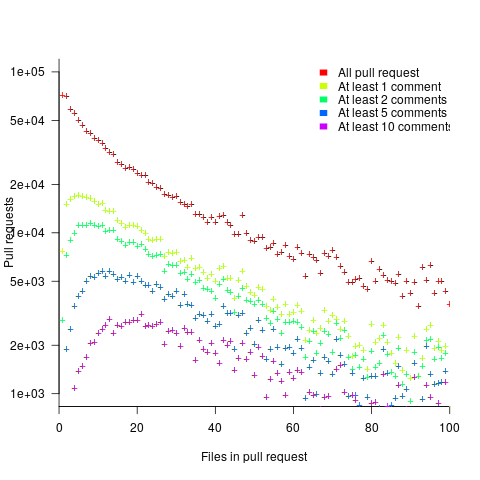
Many factors could influence the number of comments associated with a pull request; for instance, the number of people commenting, the amount of changed code, whether the code is a test case, and the number of files already reviewed (all items which happen to be present in the available data).
One factor for which information is not present in the data is social loafing, where people exert less effort when they are part of a larger group; or at least I did not find a way of easily estimating this factor.
The best model I could fit to all pull requests containing less than 10 files, and having a total of at least one comment, explained 36% of the variance present, which is not great, but something to talk about. There was a 16% decline in comments for successive files reviewed, test cases had 50% fewer comments, and there was some percentage increase with lines added; number of comments increased by a factor of 2.4 per additional commenter (is this due to importance of the file being reviewed, with importance being a metric not present in the data).
The model does not include information available in the data, such as file contents (e.g., Java, C++, configuration file, etc), and there may be correlated effects I have not taken into account. Consequently, I view the model as a rough guide.
Is the impact of file order on number of comments a side effect of some unrelated process? One way of showing a causal connection is to run an experiment.
The experiment run by the authors involved two five files, each with the first and last containing one seeded coding mistake. The 102 subjects were asked to review the two five files, with mistake file order randomly selected. The experiment looks well-structured and thought through (many are not), but the analysis of the results is confused.
The good news is that the seeded coding mistake in the first file was much more likely to be detected than the mistake in the second last file, and years of Java programming experience also had an impact (appearing first had the same impact as three years of Java experience). The bad news is that the model (a random effect model using a logistic equation) explains almost none of the variance in the data, i.e., these effects are tiny compared to whatever other factors are involved; see code+data.
What other factors might be involved?
Most experiments show a learning effect, in that subject performance improves as they perform more tasks. Having subjects review many pairs of files would enable this effect to be taken into account. Also, reviewing multiple pairs would reduce the impact of random goings-on during the review process.
The identity of the seeded mistake did not have a significant impact on the model.
Review comments are an important issue which is amenable to practical experimental investigation. I hope that the researchers run more experiments on this issue.
Software engineering experiments: sell the idea, not the results
A new paper investigates “… the feasibility of stealthily introducing vulnerabilities in OSS via hypocrite commits (i.e., seemingly beneficial commits that in fact introduce other critical issues).” Their chosen Open source project was the Linux kernel, and they submitted three patches to the kernel review process.
This interesting idea blew up in their faces, when the kernel developers deduced that they were being experimented on (they obviously don’t have a friend on the inside). The authors have come out dodging and weaving.
What can be learned by reading the paper?
Firstly, three ‘hypocrite commits’ is not enough submissions to do any meaningful statistical analysis. I suspect it’s a convenience sample, a common occurrence in software engineering research. The authors sell three as a proof-of-concept.
How many of the submitted patches passed the kernel review process?
The paper does not say. The first eight pages provide an introduction to the Open source development model, the threat model for introducing vulnerabilities, and the characteristics of vulnerabilities that have been introduced (presumably by accident). This is followed by 2.5 pages of background and setup of the experiment (labelled as a proof-of-concept).
The paper then switches (section VII) to discussing a different, but related, topic: the lifetime of (unintended) vulnerabilities in patches that had been accepted (which I think should have been the topic of the paper. This interesting discussion is 1.5 pages; also see The life and death of statically detected vulnerabilities: An empirical study, covered in figure 6.9 in my book.
The last two pages discuss mitigation, related work, and conclusion (“…a proof-of-concept to safely demonstrate the practicality of hypocrite commits, and measured and quantified the risks.”; three submissions is not hard to measure and quantify, but the results are not to be found in the paper).
Having the paper provide the results (i.e., all three commits spotted, and a very negative response by those being experimented on) would have increased the chances of negative reviewer comments.
Over the past few years I have started noticing this kind of structure in software engineering papers, i.e., extended discussion of an interesting idea, setup of experiment, and cursory or no discussion of results. Many researchers are willing to spend lots of time discussing their ideas, but are unwilling to invest much time in the practicalities of testing them. Some reviewers (who decide whether a paper is accepted to publication) don’t see anything wrong with this approach, e.g., they accept these kinds of papers.
Software engineering research remains a culture of interesting ideas, with evidence being an optional add-on.
Pricing by quantity of source code
Software tool vendors have traditionally licensed their software on a per-seat basis, e.g., the cost increases with the number of concurrent users. Per-seat licensing works well when there is substantial user interaction, because the usage time is long enough for concurrent usage to build up. When a tool can be run non-interactively in the cloud, its use is effectively instantaneous. For instance, a tool that checks source code for suspicious constructs. Charging by lines of code processed is a pricing model used by some tool vendors.
Charging by lines of code processed creates an incentive to reduce the number of lines. This incentive was once very common, when screens supporting 24 lines of 80 characters were considered a luxury, or the BASIC interpreter limited programs to 1023 lines, or a hobby computer used a TV for its screen (a ‘tiny’ CRT screen, not a big flat one).
It’s easy enough to splice adjacent lines together, and halve the cost. Well, ease of splicing depends on programming language; various edge cases have to be handled (somebody is bound to write a tool that does a good job).
How does the tool vendor respond to a (potential) halving of their revenue?
Blindly splicing pairs of lines creates some easily detectable patterns in the generated source. In fact, some of these patterns are likely to be flagged as suspicious, e.g., if (x) a=1;b=2; (did the developer forget to bracket the two statements with { }).
The plot below shows the number of lines in gcc 2.95 containing a given number of characters (left, including indentation), and the same count after even-numbered lines (with leading whitespace removed) have been appended to odd-numbered lines (code+data, this version of gcc was using in my C book):
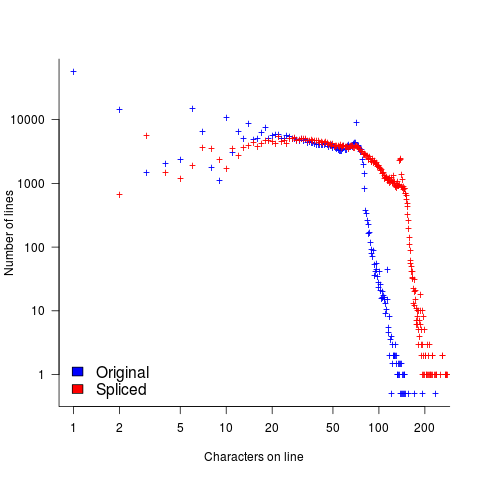
The obvious change is the introduction of a third straight’ish line segment (the increase in the offset of the sharp decline might be explained away as a consequence of developers using wider windows). By only slicing the ‘right’ pairs of lines together, the obvious patterns won’t be present.
Using lines of codes for pricing has the advantage of being easy to explain to management, the people who sign off the expense, who might not know much about source code. There are other metrics that are much harder for developers to game. Counting tokens is the obvious one, but has developer perception issues: Brackets, both round and curly. In the grand scheme of things, the use/non-use of brackets where they are optional has a minor impact on the token count, but brackets have an oversized presence in developer’s psyche.
Counting identifiers avoids the brackets issue, along with other developer perceptions associated with punctuation tokens, e.g., a null statement in an else arm.
If the amount charged is low enough, social pressure comes into play. Would you want to work for a company that penny pinches to save such a small amount of money?
As a former tool vendor, I’m strongly in favour of tool vendors making a healthy profit.
Creating an effective static analysis requires paying lots of attention to lots of details, which is very time-consuming. There are lots of not particularly good Open source tools out there; the implementers did all the interesting stuff, and then moved on. I know of several groups who got together to build tools for Java when it started to take-off in the mid-90s. When they went to market, they quickly found out that Java developers expected their tools to be free, and would not pay for claimed better versions. By making good enough Java tools freely available, Sun killed the commercial market for sales of Java tools (some companies used their own tools as a unique component of their consulting or service offerings).
Could vendors charge by the number of problems found in the code? This would create an incentive for them to report trivial issues, or be overly pessimistic about flagging issues that could occur (rather than will occur).
Why try selling a tool, why not offer a service selling issues found in code?
Back in the day a living could be made by offering a go-faster service, i.e., turn up at a company and reduce the usage cost of a company’s applications, or reducing the turn-around time (e.g., getting the daily management numbers to appear in less than 24-hours). This was back when mainframes ruled the computing world, and usage costs could be eye-watering.
Some companies offer bug-bounties to the first person reporting a serious vulnerability. These public offers are only viable when the source is publicly available.
There are companies who offer a code review service. Having people review code is very expensive; tools are good at finding certain kinds of problem, and investing in tools makes sense for companies looking to reduce review turn-around time, along with checking for more issues.
The Empirical Investigation of Perspective-Based Reading: Data analysis
Questions about the best way to perform code reviews go back almost to the start of software development. The perspective-based reading approach focuses reviewers’ attention on the needs of the users of the document/code, e.g., tester, user, designer, etc, and “The Empirical Investigation of Perspective-Based Reading” is probably the most widely cited paper on the subject. This paper is so widely cited I decided it was worth taking the time to email the authors of a 20 year old paper asking if the original data was available and could I have a copy to use in a book I am working on. Filippo Lanubile’s reply included two files containing the data (original files, converted files+code)!
How do you compare the performance of different approaches to finding problems in documents/code? Start with experienced subjects, to minimize learning effects during the experiment (doing this also makes any interesting results an easier sell; professional developers know how unrealistic student performance tends to be); the performance of subjects using what they know has to be measured first, learning another technique first would contaminate any subsequent performance measurements.
In this study subjects reviewed four documents over two days; the documents were two NASA specifications and two generic domain specifications (bank ATM and parking garage); the documents were seeded with faults. Subjects were split into two groups and read documents in the following sequences:
Group 1 Group 2 Day 1 NASA A NASA B ATM PG Day 2 Perspective-based reading training PG ATM NASA B NASA A |
The data contains repeated measurements of the same subject (i.e., their performance on different documents using one of two techniques), so mixed-model regression has to be used to build a model.
I built two models, one for number of faults detected and the another for the number of false positive faults flagged (i.e., something that was not a fault flagged as a fault).
The two significant predictors of percentage of known faults detected were kind of document (higher percentage detected in the NASA documents) and order of document processing on each day (higher percentage reported on the first document; switching document kind ordering across groups would have enabled more detail to be teased out).
The false positive model was more complicated, predictors included number of pages reviewed (i.e., more pages reviewed more false positive reports; no surprise here), perspective-based reading technique used (this also included an interaction with number of years of experience) and kind of document.
So use of perspective-based reading did not make a noticeable difference (the false positive impact was in amongst other factors). Possible reasons that come to mind include subjects not being given enough time to switch reading techniques (people need time to change established habits) and some of the other reading techniques used may have been better/worse than perspective-based reading and overall averaged out to no difference.
This paper is worth reading for the discussion of the issues involved in trying to control factors that may have a noticeable impact on experimental results and the practical issues of using professional developers as subjects (the authors clearly put a lot of effort into doing things right).
Please let me know if you build any interesting model using the data.
Recent Comments