Archive
Patterns of regular expression usage: duplicate regexs
Regular expressions are widely used, but until recently they were rarely studied empirically (i.e., just theory research).
This week I discovered two groups studying regular expression usage in source code. The VTSBULeeLab has various papers analysing 500K distinct regular expressions, from programs written in eight languages and StackOverflow; Carl Chapman and Peipei Wang have been looking at testing of regular expressions, and also ran an interesting experiment (I will write about this when I have decoded the data).
Regular expressions are interesting, in that their use is likely to be purely driven by an application requirement; the use of an integer literals may be driven by internal housekeeping requirements. The number of times the same regular expression appears in source code provides an insight (I claim) into the number of times different programs are having to solve the same application problem.
The data made available by the VTSBULeeLab group provides lots of information about each distinct regular expression, but not a count of occurrences in source. My email request for count data received a reply from James Davis within the hour 🙂
The plot below (code+data; crates.io has not been included because the number of regexs extracted is much smaller than the other repos) shows the number of unique patterns (y-axis) against the number of identical occurrences of each unique pattern (x-axis), e.g., far left shows number of distinct patterns that occurred once, then the number of distinct patterns that each occur twice, etc; colors show the repositories (language) from which the source was obtained (to extract the regexs), and lines are fitted regression models of the form:  , where:
  is driven by the total amount of source processed and the frequency of occurrence of regexs in source, and
  is the rate at which duplicates occur.
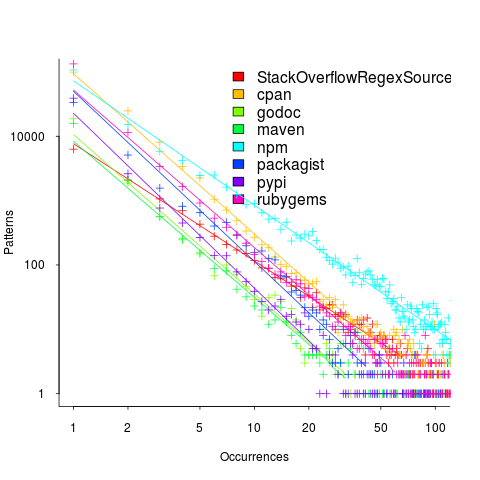
So most patterns occur once, and a few patterns occur lots of times (there is a long tail off to the unplotted right).
The following table shows values of for the various repositories (languages):
StackOverflow   cpan    godoc    maven    npm  packagist   pypi   rubygems
-1.8 -2.5 -2.5 -2.4 -1.9 -2.6 -2.7 -2.4 |
The lower (i.e., closer to zero) the value of , the more often the same regex will appear.
The values are in the region of -2.5, with two exceptions; why might StackOverflow and npm be different? I can imagine lots of duplicates on StackOverflow, but npm (I’m not really familiar with this package ecosystem).
I am pleased to see such good regression fits, and close power law exponents (I would have been happy with an exponential fit, or any other equation; I am interested in a consistent pattern across languages, not the pattern itself).
Some of the code is likely to be cloned, i.e., cut-and-pasted from a function in another package/program. Copy rates as high as 70% have been found. In this case, I don’t think cloned code matters. If a particular regex is needed, what difference does it make whether the code was cloned or written from scratch?
If the same regex appears in source because of the same application requirement, the number of reuses should be correlated across languages (unless different languages are being used to solve different kinds of problems). The plot below shows the correlation between number of occurrences of distinct regexs, for each pair of languages (or rather repos for particular languages; top left is StackOverflow).
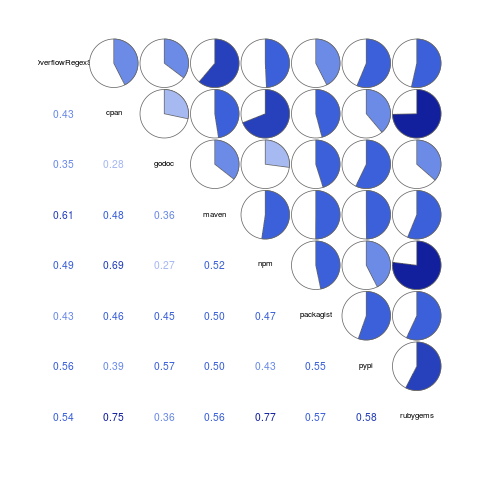
Why is there a mix of strong and weakly correlated pairs? Is it because similar application problems tend to be solved using different languages? Or perhaps there are different habits for cut-and-pasted source for developers using different repositories (which will cause some patterns to occur more often, but not others, and have an impact on correlation but not the regression fit).
There are a lot of other interesting things that can be done with this data, when connected to the results of the analysis of distinct regexs, but these look like hard work, and I have a book to finish.
Empirical software engineering is five years old
Science and engineering are built on theoretical models that are tested against measurements of ‘reality’. Until around 10 years ago there was very little software engineering ‘reality’ publicly available; companies rarely made source available and were generally unforthcoming about any bugs that had been discovered. What happened around 10 years ago was the creation of public software repositories such as SourceForge and public fault databases such as Bugzilla. At last researchers had access to what could be claimed to be real world data.
Over the last five years there has been an explosion of papers using SourceForge/Bugzilla kinds of data looking for a connection between everything+kitchen sink and faults. The traditional measures such as Halstead and McCabe have not stood up well against this onslaught of data, hardly surprising given they were more or less conjured out of thin air. Some researchers are trying to extract information about developer characteristics from mailing lists; given that software is written by developers there is obviously a real need for the characteristics of major project contributors to play a significant role in any theory of software faults.
Software engineering data includes a lot more than what can be extracted from source code, bug lists and email lists. A growing number of repositories have been set up to hold measurement and experimental data, e.g., hardware failures, effort prediction (while some of this data is pre-2000 it tends to be low volume or poor quality), and file system related.
At the individual level a small number of researchers have made data available on their own web site, a few more will send a copy if asked and sadly there are many cases where the raw data has been lost. In two recent cases researchers have responded to my request for raw data by telling me they are working on additional papers and don’t want to make the data public yet. I can understand that obtaining interesting data requires a lot of work and researchers want to extract maximum benefit; I look forward to see the new papers and the eventual availability of the data.
My interest in all this data is that I have started work on a book covering empirical software engineering using R. Five years ago such book would have contained lots of equations, plenty of hand waving and if data sets were available they would probably have been small enough to print on one page. Today there are still plenty of equations (mostly relating to statistical this that and the other), no hand waving (well, none planned), data sets for everything covered (some in the gigabytes and a few that can still fit on a page) and pretty pictures (color graphs, as least for the pdf version).
When historians trace back the history of empirical software engineering I think they will say that it started for real sometime around 2005. Before then, any theories that were based on observation tended to have small, single study, data sets with little statistical significance or power.
Has the seed that gets software development out of the stone-age been sown?
A big puzzle for archaeologists is why Stone Age culture lasted as long as it did (from approximately 2.5 millions years ago until the start of the copper age around 6.3 thousand years ago). Given the range of innovation rates seen in various cultures through-out human history, a much shorter Stone Age is to be expected. A recent paper proposes that low population density is what maintained the Stone Age status quo; there was not enough contact between different hunter gather groups for widespread take up of innovations. Life was tough, and the viable lifetime of individual groups of people may not have been long enough for them to be likely to pass on innovations (either their own ones encountered through contact with other groups).
Software development is often done by small groups that don’t communicate with other groups and regularly die out (well there is a high turn-over, with many of the more experienced people moving on to non-software roles). There are sufficient parallels between hunter gathers and software developers to suggest both were/are kept in a Stone Age for the same reason, lack of a method that enables people to obtain information about innovations and how worthwhile these might be within a given environment.
A huge barrier to the development of better software development practices is the almost complete lack of significant quantities of reliable empirical data that can be used to judge whether a claimed innovation is really worthwhile. Companies rarely make their detailed fault databases and product development history public; who wants to risk negative publicity and lawsuits just so academics have some data to work with.
At the start of this decade, public source code repositories like SourceForge and public software fault repositories like Bugzilla started to spring up. These repositories contain a huge amount of information about the characteristics of the software development process. Questions that can be asked of this data include: what are common patterns of development and which ones result in fewer faults, how does software evolve and how well do the techniques used to manage it work.
Empirical software engineering researchers are now setting up repositories, like Promise, containing the raw data from their analysis of Open Source (and some closed source) projects. By making this raw data available, they are reducing the effort needed by other researchers to investigate their own alternative ideas (I have just started a book on empirical software engineering using the R statistical language that uses examples based on this raw data).
One of the side effects of Open Source development could be the creation of software development practices that have been shown to be better (including showing that some existing practices make things worse). The source of these practices not being what the software developers themselves do or how they do it, but the footsteps they have left behind in the sand.
Using third party measurement data
Until today, to the best of my knowledge, all the source code analysis papers I have read were written by researchers who had control of the code analysis tools they used and had some form of localised access to the source. By control of the code analysis tools I mean that the researchers specified the tool options and had the ability to check the behavior of the tool, in many cases the source of the tool was available to them and often even written by them, and the localised access may have involved downloading lots of code from the web.
I have just been reading about a broad brush analysis of comment usage based on data provided by a commercial code repository that offers API access to some basic code metrics.
At first, I was very frustrated by the lack of depth to the analysis provided in the paper, but then I realised that the authors’ intent was to investigate a few broad ideas about comment usage in a large number of projects (around 10,000). The authors complained in their blog about some of the referees comments and having to submit a shorter paper. I can see where the referees are coming from, the papers are lacking in depth of analysis, but they do contain some interesting results.
I was very interested in Figure 2:
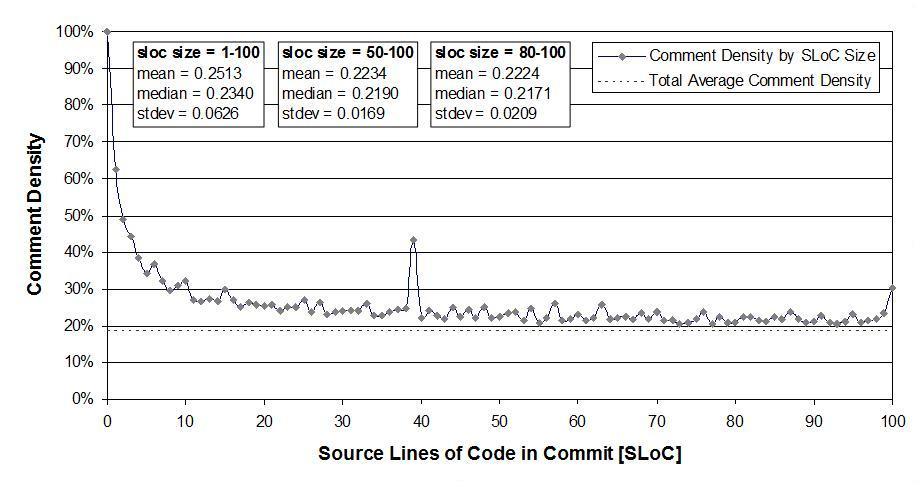
which plots the comment density of the lines in a source code commit. I would expect the ratio to be higher for small commits because a developer probably has a relatively fixed amount to say about updates involving a smallish number of lines (which probably fixes a problem). Larger commits are probably updated functionality and so would have a comment density similar to the ‘average’.
The problem with relying on third parties to supply the data is that obtaining the answers to follow up questions invariably involves lots of work, e.g., creating an environment to perform the measurements needed for the follow-up questions. However, the third party approach can significantly reduce the amount of work needed to get to a point where the interestingness of the results can be gauged.