Archive
Techniques used for analyzing basic performance measurements
The statistical design and analysis of experiments is a relatively recent invention (around 150 years old; verifying scientific hypotheses using experiments was first proposed over 1,000 years ago).
Once an experiment has been run, and performance measurements collected, what techniques are available to analyse the data?
Before electronic computers were invented, the practical statistical techniques were those that could be performed manually (perhaps with some help from a mechanical calculator).
Once computers became available, these manual use techniques were widely implemented in statistical applications and libraries. New statistical techniques have been invented that are only of practical when a computer is available, e.g., the bootstrap.
Most researchers in software engineering remain stuck in the pre-computer world of statistical analysis, i.e., failing to use more powerful techniques that make use of computers. Software engineering is not unique in being stuck using pre-computer statistical techniques, there are many other fields that have failed to move on to the more flexible and powerful techniques now available.
Performance comparison by benchmarking (i.e., running an experiment) is a common activity in scientific and engineering fields. Once the measurements have been made, what is the difference between pre-computer and post-manual statistical comparison techniques?
Performance comparison invariably involves comparing the mean/average of each set of measurements (one set for each product benchmarked). Random variations will have some impact on the measured values, and it’s possible that any difference in mean values is the result of these random variations. There are statistical tests for estimating the likelihood of the difference being due to random variation.
Statistical tests invariably come with preconditions on the characteristics of their input data, i.e., the test only works as advertised if the preconditions are met.
The t.test is a popular pre-computer method of estimating the likelihood that the difference between the means of two sets of measurements occurred by chance. Two of its preconditions are that the two sets of input data have a Normal/Gaussian distribution, and have the same standard deviation (if the standard deviations are not equal, Welch’s t-test should be used).
The Mann–Whitney U test (also known as the Wilcoxon rank-sum test) is a pre-computer method with a more relaxed precondition on the distribution of the inputs, requiring only that they are drawn from the same distribution (which need not be a Normal distribution; it is a non-parametric test). This test returns the likelihood of one group being less/greater than the other, and says nothing about the magnitude of the difference.
Removing the constraint that it must be practical to manually perform the calculations, led, in 1979, to a paper proposing the Bootstrap (major issues around the theory underpinning the bootstrap were answered by the early 1990s).
The Bootstrap, a post-manual method, does not have any preconditions on the distribution or standard deviation of the input data. An important precondition is that it is reasonable to assume that the elements of the two sets of measurements are exchangeable (more on this below).
The Bootstrap is a general technique that is not limited to only comparing mean values, it can be used to compare any quantity of interest (assuming the appropriate data is available).
The bootstrap algorithm starts by assuming that, if the two samples are combined into an aggregate sample, all possible permutations of values in this aggregate into two samples are equally likely (this is the exchangeability assumption). If this assumption is true, then any compared difference in the measured two samples will be roughly the same as the compared difference in a pair of random samples drawn from the aggregate.
The computational intensive component of a bootstrap test is generating many pairs of random samples (5,000 is a common choice; sampling with replacement, and saving the result of the comparison).
The comparison results of the paired random samples and the two measured samples are sorted. The position of the measured comparison in this sorted list is the test statistic, i.e., how extreme is the result from the measured samples, compared to the random samples?
News of the flexibility and power of the bootstrap are slowly permeating through the research community. There is an existing way of doing things, and there is little incentive to change. As Plank famously observed: “Science advances one funeral at a time.”
Estimating variance when measuring source
Yesterday I finally delivered a paper on if/switch usage measurements to the ACCU magazine editor and today I read about a switch statement usage that, if common, would invalidate a chunk of my results. Does anything jump out at you in the following snippet?
switch (x) { case 1: { z++; ... break; } ... |
Yes, those { } delimiting the case-labeled statement sequence. A quick check of my C source benchmarks showed this usage occurring in around 1% of case-labels. Panic over.
What is the statistical significance, i.e., variance, of that 1%? Have I simply measured an unrepresentative sample, what would be a representative sample and what would be the expected variance within a representative sample?
I am interested in commercial software development, and so I have selected half a dozen or so largish code bases as my source benchmark, preferably written in a commercial environment even if currently available as Open source. I would prefer this benchmark to be an order of magnitude larger, and perhaps I will get around to adding more programs soon.
My if/switch measurements were aimed at finding usage characteristics that varied between the two kinds of selection statements. One characteristic measured was the number of equality tests in the associated controlling expression. For instance, in:
if (x == 1 || x == 2) z--; else if (x == 3) z++; |
the first controlling expression contains two equality tests, and the second one equality test.
Plotting the percentage of equality tests that occur in the controlling expressions of if-if/if-else-if sequences and switch statements, we get the following:
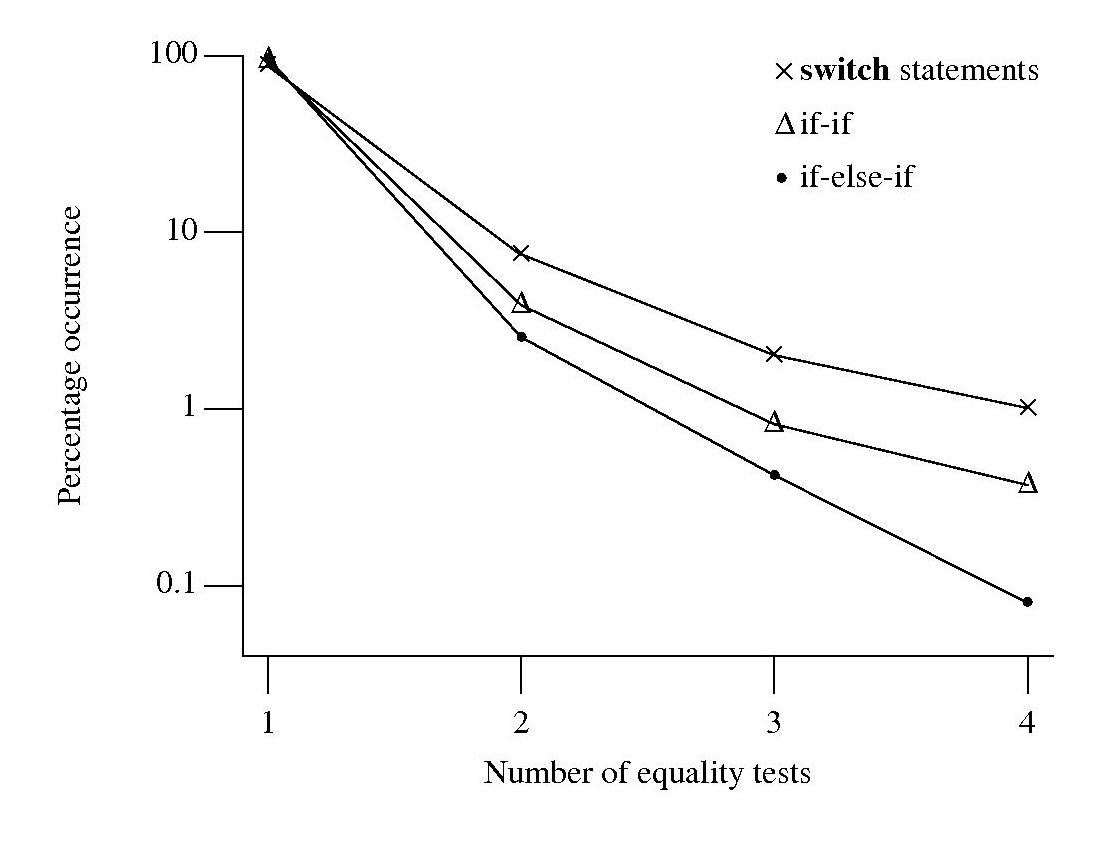
Do these results indicate that if-if/if-else-if sequences and switch statements differ in the number of equality tests contained in their controlling expressions? If I measured a completely different set of source code, would the results be very different?
To answer this question, a probability model is needed. Take as an example, the controlling expressions present in an if-if sequence. If each controlling expression is independent of the others, then the probability of two equality tests, for instance, occurring in any of these expressions is constant and thus given a large sample the distribution of two equality tests in the source has a binomial distribution. The same argument can be applied to other numbers of equality tests and other kinds of sequence.
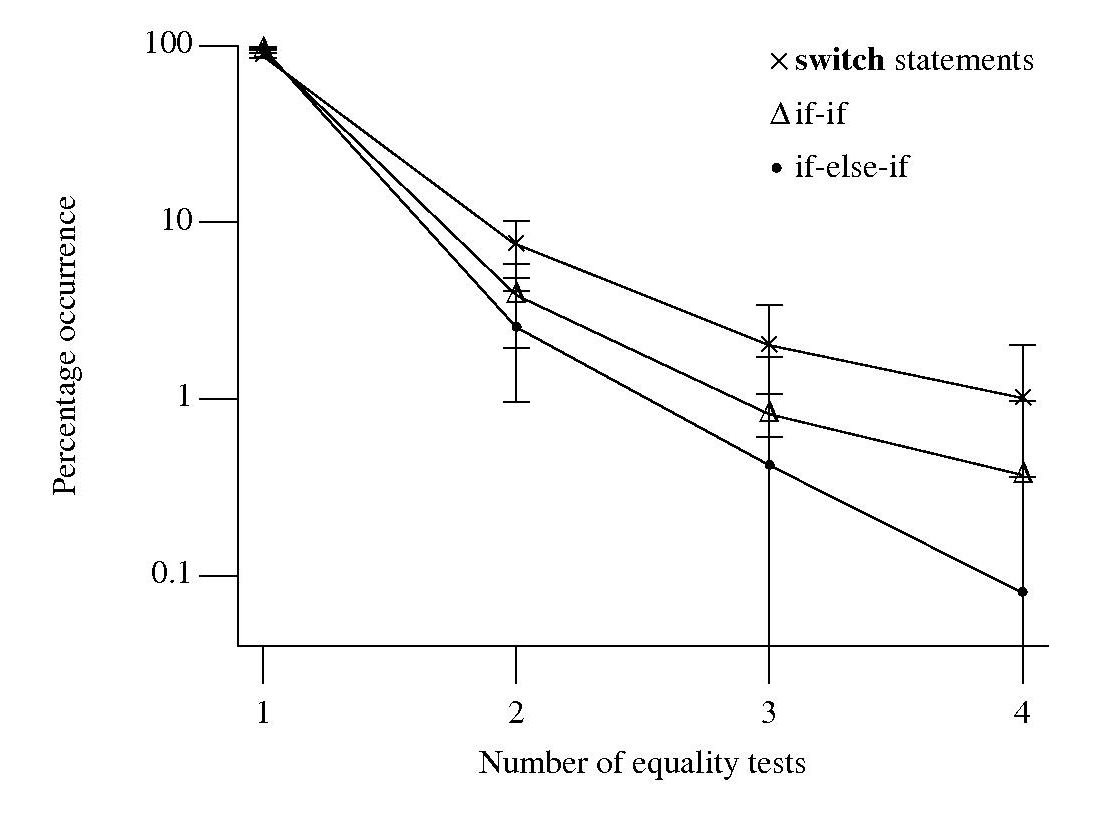
For each measurement point in the above plot the associated error bars span the square-root of the variance of that point (assuming a binomial distribution, for a normal distribution the length of this span is known as the standard deviation). The error bars overlap, suggesting that the apparent difference in percentage of equality tests in each kind of sequence is not statistically significant.
The existence of some dependency between controlling expression equality tests would invalidate this simply analysis, or at least reduce its reliability. I did notice that in a sequence that containing two equality tests, the controlling expression that contained it tended to appear later in the sequence (the reverse of the example given above). Did I notice this because I tend to write this way? A question for another day.
Average distance between two fields
If I randomly pick two fields from an aggregate type definition containing N fields what will be the average distance between them (adjacent fields have distance 1, if separated by one field they have distance 2, separated by two fields they have distance 3 and so on)?
For example, a struct containing five fields has four field pairs having distance 1 from each other, three distance 2, two distance 2, and one field pair having distance 4; the average is 2.
The surprising answer, to me at least, is (N+1)/3.
Proof: The average distance can be obtained by summing the distances between all possible field pairs and dividing this value by the number of possible different pairs.
                  Distance 1  2  3  4  5  6
Number of fields
            4              3  2  1
            5              4  3  2  1
            6              5  4  3  2  1
            7              6  5  4  3  2  1
The above table shows the pattern that occurs as the number of fields in a definition increases.
In the case of a definition containing five fields the sum of the distances of all field pairs is: (4*1 + 3*2 + 2*3 + 1*4) and the number of different pairs is: (4+3+2+1). Dividing these two values gives the average distance between two randomly chosen fields, e.g., 2.
Summing the distance over every field pair for a definition containing 3, 4, 5, 6, 7, 8, … fields gives the sequence: 1, 4, 10, 20, 35, 56, … This is sequence A000292 in the On-Line Encyclopedia of Integer sequences and is given by the formula n*(n+1)*(n+2)/6 (where n = N − 1, i.e., the number of fields minus 1).
Summing the number of different field pairs for definitions containing increasing numbers of fields gives the sequence: 1, 3, 6, 10, 15, 21, 28, … This is sequence A000217 and is given by the formula n*(n + 1)/2.
Dividing these two formula and simplifying yields (N + 1)/3.
Recent Comments