Archive
The lifetime of performance coding issues
Coding activities that a developer might spend time on include: adding new functionality, fixing a reported fault, or fiddling with existing code with the intent of making it ‘better’ in some sense (which these days goes by the catch-all name of refactoring).
Improving performance, e.g., changing software to use less cpu/memory is considered, by developers, to make it ‘better’ (whether users are likely to notice the difference, or management see a ROI is for another article). There is a breed of developer whose DNA encodes for pleasure receptors that are only fire when working to reduce the amount of cpu/memory used by a program.
The paper Characterizing the evolution of statically-detectable performance issues of Android Apps by Das, Di Penta, and Malavolta studied the creation/removal of nine distinct performance coding issues in the source of 316 Android Apps (118 Apps contained five or more issues); a total of 2,408 performance issues were tracked.
What patterns might be present in the paper’s performance issues data?
I would expect there to be more creations in Apps containing more code, and more removals the longer an App is maintained; both very obvious. With more developers working on an App, there are going to be more creations and removals; do they cancel out? Management might decide to invest time in performance improvements for the next release, which would cause a spike in the number of removals per unit time.
How long do the nine performance issues survive in code, before being removed? The plot below shows the Kaplan Meier survival curve for Apps containing at least five issues (dotted blue/green are the 95% confidence intervals, code+data):
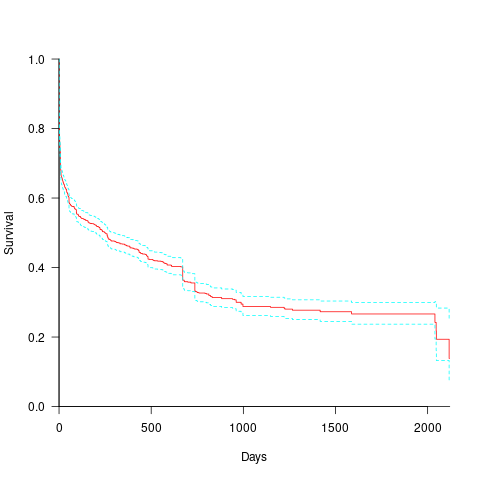
Around 15% of issues were removed on the day they are created, and by the eighth day around 30% had been removed. The roughly steady decline lasts for two-years, followed by almost stasis. Is two-years the active development lifetime of a successful Android App?
In isolation, the slope of the survival curve between eight days and two-years is not that interesting (it could be used to rule out models of the issue discovery process, e.g., happenstance discovery while working on other tasks). However, comparing it against the corresponding survival curve for reported faults tells us something about developer/management investment priorities for the two kinds of tasks, as measured by time to fix (which is a proxy for effort invested).
Unfortunately, this study did not collect information on coding mistake lifetimes, or time between a fault being reported and fixed. There have been studies investigating the survival time of coding mistakes. Reported faults should have the lowest survival rate, while the survival of coding mistakes will depend on the number of users (i.e., more users creates more opportunities to experience a fault and report it).
What factors influence performance issue time-to-fix?
The data includes information on the kind of performance issue, the number of times the App has been downloaded from the Google Play Store, and the number of contributors to the App.
Using these variables, a Cox proportional hazards model was fitted to model the survival time. In a proportional hazards model, the model coefficients are not absolute values, but provide ratio information. For instance, the following table shows the coefficients of the fitted model (code+data). Using these coefficients, we can compare the time taken to fix, say, a FloatMath issue relative to a ViewTag issue. The coefficient ratio  is the estimated ratio of fix times of the two respective issues.
Coefficient Standard error Performance issue FloatMath 0.64445 0.14175 HandlerLeak 0.69958 0.12736 Recycle 0.83041 0.11386 UseSparseArrays 0.73471 0.12493 UseValueOf 0.64263 0.11827 ViewHolder 0.87253 0.14951 ViewTag 5.24257 0.46500 Wakelock 3.34665 0.72014 Downloads 50-100 0.62490 0.26245 100-500 0.64699 0.22494 500-1000 0.56768 0.23505 1000-5000 0.50707 0.22225 5000-10000 0.53432 0.22486 10000-50000 0.62449 0.21626 50000-100000 0.42214 0.23402 100000-500000 0.21479 0.25358 1000000-5000000 0.40593 0.21851 10000000-50000000 0.03474 0.61827 100000000-500000000 0.30693 0.39868 1000000000-5000000000 0.41522 0.61599 NA 0.03868 1.02076 Contributors 1.04996 0.01265 |
There is not a lot of difference in the coefficients for the number of downloads (the model fit is poor when the Standard error is close to the Coefficient value).
The paper Investigating Types and Survivability of Performance Bugs in Mobile Apps analyses a smaller dataset of performance issue lifetimes.
My first day developing for Google Glass
I was at the Google Glass Design Sprint & Workshop in London today. I don’t own a Google Glass and applied for one of the limited spaces available to developers who would be lent hardware for the day. Any idea I was harboring of Google recognizing me as an ace hackathon attendee were dashed at the start when we were told that the available slots had been filled by a random draw of applicants.
Vendor presentations at the start of hackathons tend to be either deadly dull or eye opening. Timothy Jordan explained why software written for Google Glass were not Apps, or rather should not be written with this mindset, but needed to be thought of in terms of enhancing the user’s experience in real time the moment; this really clicked with me. He also made some excellent points on user interface issues specific to the glass form factor which I think went over the head of most people present (this really needed its own slot).
I turned up with an App user enhancement experience reasonably well formed in my mind. The idea was to port the numbers tool to Android and have it scan the incoming camera image for numbers, information about the interesting ones being spoken into the users ear (e.g., that number of there is the rest mass of the electron).
On the day Google handled out a half a dozen brief biographies of potential Glass users and asked us to come up with ideas for software to enhance the lives of these people. I came up with the idea for helping the triathlete on the cycling leg of his competition. Having watched highlights from the Tour de France I knew that corners on the downhill stages of mountain routes presented a significant problem to riders traveling at up to 65 mph, i.e., how hard should they break to get safely around a corner whose curvature they could not see. My idea was for the corner curvature user experience to come to life when the riders speed exceeded, say, 45 mph and displayed a simple colored wiggly line that represented what lies around the bend.
Listening to other people at my table and in other groups I was surprised at how many were designing their idea as an App; that is, they wanted user to select from drop down menus and/or specify various numeric/literal values. My pointing out that they were designing Apps was met with blank stares.
Progress on writing actual code was hampered by lunch, having to leave at 17:30 and adb not working out of the box under Windows (this prevented any communication between the Android SDK running on Windows and Google glass). It took a while to figure out that the problem was adb/Windows (the Google folk had no idea it did not work since they all used Linux or Apple Macs). As usual an answer on Stackoverflow explained what changes needed to be made to the Google software. Asking around uncovered a few people with horror stories to tell about getting adb communication under Windows.
Microsoft Windows has significantly slipped in developer tool mind share over the last few years (I am even thinking of buying my first Mac next time I change my laptop). However, there are still a lot of Windows developers out there and Google will need to fix this problem if they want to attract lots and lots of developers.
But the biggest mistake Google need to fix is to make sure they don’t ever again run out of coffee mid-afternoon at an all day hackathon.
MyFloodPlan: The personalized flood plan App
I took part in the HackTheTownHall flood-relief hackathon at the weekend. Team MyFloodPlan (me, Manoj, Lusine, Anthony and Sanjeet) built an App (try it) that created personalised flood plans; tell us where you live and we tell you number of hours before the flood water reaches you, plus providing a list of recommended actions for that time frame, with the timing of the recommended actions being influenced by personal circumstances such as age (older people likely to take longer to do things than younger people), medical situation and risk aversion. The App has five prespecified users at various locations in the worst hit flooding areas around west London in February 2014. UK Government recommendations are basically to move things to higher ground (e.g., upstairs) and just as the water arrives at your door turn off the gas and electric.
The App used the Ordnance Survey Terrain 50 data (height above sea level of 50 meter squares covering the whole UK and accurate to 0.01 0.1 meters) to find the difference in height between the user’s location and the last reported local flood height (we faked this number), multiplied this by how fast the flood water is rising (we picked 100 10 cm per hour) to find out how many minutes it would take for the flood to reach the user’s location. In practice it would be easy to get the current flood height, the user could simply walk to the current edge of the flood and tell the App where it was; data on rate of height increase/decrease could come from the Environment agency flood warning site.
The Ordnance survey has height data at 5 meter square resolution and supplied a sample for an area near Bristol. The accuracy of GPS is nowhere near good enough for obtaining height data. Altitude data for most of the world is available thanks to the Shuttle Radar Topography Mission; the grid resolution is 30 meters in the US and 90 meters outside the US.
I thought of creating a 2-D equation that interpolated between all known points (using say, cubic splines), this would smooth out height discontinuities and probably improve the estimates for most locations. But given the large unknowns in rate of change of flood water height, interpolation seemed like over-kill (given how smooth the data is over much of the UK this approach might be away of reducing data storage/access).
The big unknown in all of this is modeling changes in flood water level. In February there were announcements that gave maximum levels. The ideal situation is for the Environment agency to provide a predicted flood water level time line API. They probably have the predictions, but given the degree of uncertainties present in all models I would understand any reluctance in making this information available in real time.
On the ground monitoring the progress of a flood would only take a few people on bikes to cover a whole town, reporting back to a local system that kept everybody updated. Real-time flood level tracking is not a big data problem (prediction and maintaining historical data are) and a handful of people using modest computer resources could easily provide a personalized flood warning service to locals.
Team MyFloodPlan was made up of Team prompt Parking (minus Bob), from a previous hackathon, plus two other people, and these provided a useful reminder of the mindset needed for a hackathon. Producing a working App in 24 hours requires keeping things simple and doing what needs to be done; sometimes outrageous simplifications have to be made and the most awful coding solutions have to be lived with. Our two new members (a business consultant and very clever technical guy) were into considering all the issues and how they connected, and looking to keep all potential customers happy; all good stuff to do when there is plenty of time and resources available, but fatal mistakes in a short hackathon. We spent all day going in circles around the original idea (team Prompt Parking are very laid back and prone to gossiping about tech with anybody who happens to wonder by), when the two left for the night the circling died down and within a few hours we had the basic core of the App coded and working.
The oversimplifications made by team PromptParking, along with our willingness to ignore ‘low volume’ customers left our two newbies exasperated and baffled. However, the aim is to produce the best minimum viable product, not an impressive report covering all the issues
How can flood data be monetized using an App? Floods are too rare for the MyFloodPlan App to provide a regular income. Perhaps during a flood it could cheer people up by displaying adds for holidays in sunny destinations, provide suggestions for new furniture, decorating ideas, etc and if the flood had not yet reached them the best place to sell their home.
The best money making App I could think of was one that provides flooding information to potential home buyers. The DoesThisLocationFlood App would show pictures of previous floods in the area (picture gathering would be so much easier if Twitter did not remove location information from posted pictures), along with height above local water features and distance from them. It would be great to tie in with online home purchase sites, but these make money from the seller and so are unlikely to see any added value in the DoesThisLocationFlood App.
The MyFloodPlan App came second, beaten by an App that allowed users to report and see events in a flood affected area (and made great use of text messaging). Our App was not very interactive, i.e., flood arrives in x hours, do these things. We should have been more adventurous; having been gone down the route planning rabbit hole before I shied away from figuring out which road were flooded and suggesting alternative routes (the route planners in OpenStreetMap do seem to be improving).
Thanks to Milverton for organizing the event and the knowledgeable and helpful people from the Environment agency and Ordnance survey.
A request for future events: A method of turning off the lights so people don’t have to sleep under the tables to stop the motion detectors turning the lights on.
Prompt Parking near Buckingham Palace
I was at the Urban Data Hack at the weekend run by Data Science London (doing their usual excellent job of feeding and watering us). Team Prompt Parking (me, Manoj, Lusine and Bob {of team Outlier fame}) created an App (try it) that gives drivers directions to the closest locations, in Westminster, most likely to have an empty parking space, taking into account preferences for space actually being available, distance to drive and probability of experiencing vehicle/personal crime close to the parking bay.
The default starting location is the official London residence of the Queen, which is in Westminster (most of the data came from Westminster City Council), and can be changed by entering latitude/longitude at the top of the page; in practice it would use the current location reported by the phone gps.
How does the App work? Based on your current location, day of week and time of day, it obtains data on ‘close’ parking bays (precomputed data; see below), applies the user preferences to the bay data to obtained a weighted preference for each bay, picks the four bay locations with the highest weight and feeds these locations into Google maps to draw the route.
The precomputed data included (code and data):
- mean number of empty parking spaces within every 15 minute window of a given day of the week (the week was assumed to be the only parking related cycle). The parking dataset included every parking transaction in Westminster between April 2013 to January 2014; the 861 megabyte file containing 6,967,793 transactions was boiled down to 49M using
awkto split the data up, one file per parking location, making it practical to run anRscript on each file to do the averaging (we also calculated a standard deviation which never got integrated into the weighting), - likelihood of crime against vehicles and people. The crime data included a lat/long and the ‘influence’ of each recorded crime (i.e., the likelihood of another crime being committed nearby) was assumed to have a gaussian distribution having a mean of 200 meters (chosen by a couple of white guys staring at the ceiling). The crime data was monthly and sparse (good for citizens but bad for data analysis) and ended up being amalgamated to an overall number per parking location per year (i.e., the gaussians for each crime ‘influence’ were summed over the area of Westminster),
- the distance, along streets (not flying crows), to every parking bay was calculated from 50 ‘red spots’ (these spots were chosen to be well distributed over major routes within Westminster). The App takes the user’s location and calculates the closest red spot to use for parking bay distance information.
- the data included parking cost information but we did not get around to including that in the App
The hack had prizes for various categories. Team Prompt Parking received 1st Prize for Urban Data Integration, which surprised me as I thought we were the best in some of the other categories. My heart sank when I saw the Team DeTile App (the team’s Italian accent may have thrown my spelling) which combined crime data with a property company’s API to produce a flat (apartment in the US) finder recommender running on a phone; they deserved to win the Best App category.
Team Prompt Parking did not consider how money might be made from the App; our submission report included crowd pleasing concepts such as reducing CO2 emissions and accident rates by reducing driving time to find an empty parking space. Having drivers look at ads displayed in the App would probably increase accidents.
A more promising money making App, using this data, would target traffic wardens; the data shows a higher empty bay rate than that experienced by the central London drivers I spoke to at the weekend (some obvious human biases spring to mind here). There is an opportunity here for a startup to offer traffic wardens routes tailored to maximize the number of parking tickets per hour; the company would take a percentage of the warden’s earnings.
The main lesson learned was not to create large databases in the cloud during a short hack. While one database containing all the data is a good idea in theory, in a 24 hour hackathon there is not a lot of time to iterate when database creation goes wrong (which everybodies did, several times). It is better to do as much as possible on local laptops (I split the 860M data file into smaller chunks using a local awk script rather than load it into a cloudy sql database that I then had to access remotely).
We had a separate database for each dataset, making it quick to iterate changes to each dataset and not creating dependencies that held up testing using the other datasets.
Recent Comments