Archive
Ability to remember code improves with experience
What mental abilities separate an expert from a beginner?
In the 1940s de Groot studied expertise in Chess. Players were shown a chess board containing various pieces and then asked to recall the locations of the pieces. When the location of the chess pieces was consistent with a likely game, experts significantly outperformed beginners in correct recall of piece location, but when the pieces were placed at random there was little difference in recall performance between experts and beginners. Also players having the rank of Master were able to reconstruct the positions almost perfectly after viewing the board for just 5 seconds; a recall performance that dropped off sharply with chess ranking.
The interpretation of these results (which have been duplicated in other areas) is that experts have learned how to process and organize information (in their field) as chunks, allowing them to meaningfully structure and interpret board positions; beginners don’t have this ability to organize information and are forced to remember individual pieces.
In 1981 McKeithen, Reitman, Rueter and Hirtle repeated this experiment, but this time using 31 lines of code and programmers of various skill levels. Subjects were given two minutes to study 31 lines of code, followed by three minutes to write (on a blank sheet of paper) all the code they could recall; this process was repeated five times (for the same code). The plot below shows the number of lines correctly recalled by experts (2,000+ hours programming experience), intermediates (just finished programming course) and beginners (just started programming course), left performance using ‘normal’ code and right is performance viewing code created by randomizing lines from ‘normal’ code; only the mean values in each category are available (code+data):
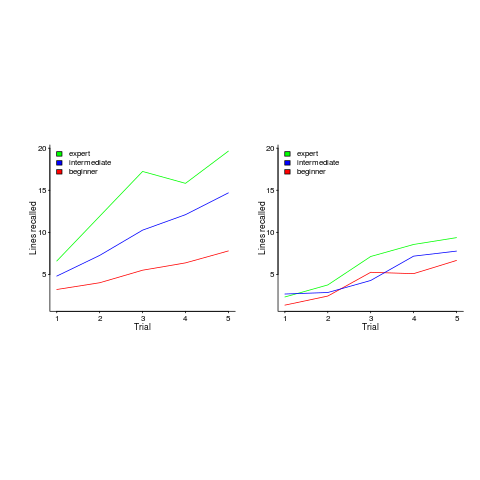
Experts start off remembering more than beginners and their performance improves faster with practice.
Compared to the Power law of practice (where experts should not get a lot better, but beginners should improve a lot), this technique is a much less time consuming way of telling if somebody is an expert or beginner; it also has the advantage of not requiring any application domain knowledge.
If you have 30 minutes to spare, why not test your ‘expertise’ on this code (the .c file, not the .R file that plotted the figure above). It’s 40 odd lines of C from the Linux kernel. I picked C because people who know C++, Java, PHP, etc should have no trouble using existing skills to remember it. What to do:
- You need five blank sheets of paper, a pen, a timer and a way of viewing/not viewing the code,
- view the code for 2 minutes,
- spend 3 minutes writing down what you remember on a clean sheet of paper,
- repeat until done 5 times.
Count how many lines you correctly wrote down for each iteration (let’s not get too fussed about exact indentation when comparing) and send these counts to me (derek at the primary domain used for this blog), plus some basic information on your experience (say years coding in language X, years in Y). It’s anonymous, so don’t include any identifying information.
I will wait a few weeks and then write up the data o this blog, as well as sharing the data.
Update: The first bug in the experiment has been reported. It takes longer than 3 minutes to write out all the code. Options are to stick with the 3 minutes or to spend more time writing. I will leave the choice up to you. In a test situation, maximum time is likely to be fixed, but if you have the time and want to find out how much you remember, go for it.
Power law of practice in software implementation
People get better with practice. The power law of practice specifies  , where:
  is the response time,
  the amount of practice and
  ,
,  and
and  are constants. However, sometimes an exponential equation is a better fit for to the data:
 } + c") . There are theoretical reasons for liking a power law (e.g., it can be derived from the chunking of information), but it is difficult to argue with the exponential fitting so much data better than a power law.
. There are theoretical reasons for liking a power law (e.g., it can be derived from the chunking of information), but it is difficult to argue with the exponential fitting so much data better than a power law.
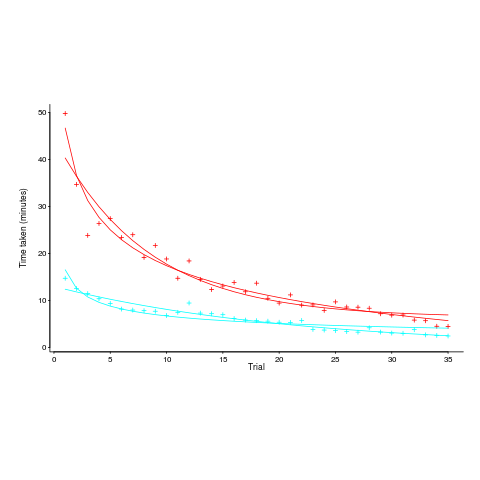
The plot below, from a study by Alteneder, shows the time taken to solve the same jig-saw puzzle, for 35 trials (red); followed by a two week pause and another 35 trials (in blue; if anybody else wants to try this, a dedicated weekend should be long enough to complete over 20 trials). The lines are fitted power law and exponential equations (code+data). Can you tell which is which?
To find out if the same behavior occurs with software we need data on developers implementing the identical applications multiple times. I know of two experiments where the same application has been implemented multiple times by the same people, and where the data is available. Please let me know if you know of any others.
Zislis timed himself implementing 12 algorithms from the CACM collection in each of three languages, iterating four times (my copy came from the Purdue library, which as I write this is not listing the report). The large number of different programs implemented, coupled with the use of multiple languages, makes it difficult to separate out learning effects.
Lui and Chan ran an experiment where 24 developers (8 pairs {pair programming} and 8 singles) implemented the same application four times. The plot below shows the time taken to complete each implementation (singles top, pairs bottom, with black cross showing predictions made by a power law fit).
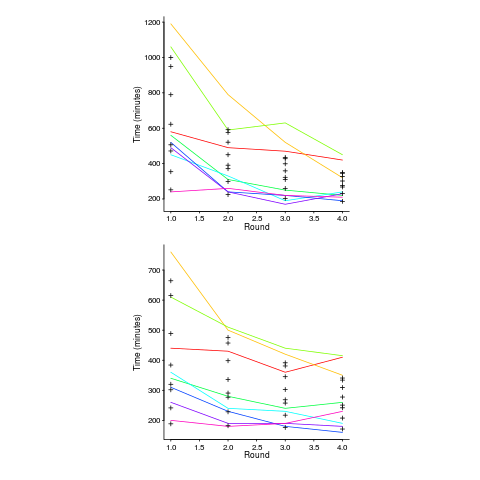
Different subjects start the experiment with different amounts of ability and past experience. Before starting, subjects took a multiple choice test of their knowledge. If we take the results of this test as a proxy for the ability/knowledge at the start of the experiment, then the power law equation becomes (a similar modification can be made to the exponential equation):
^{-b} + c")
That is, the test score is treated as equivalent to performing some number of rounds of implementation). A power law is a better fit than exponential to this data (code+data); the fit captures the general shape, but misses lots of what look like important details.
The experiment was run over successive weekends. So there was opportunity for some forgetting to occur during the week days, and the amount forgotten will vary between people. It is easy to think of other issues that could have influenced subject performance.
This experiment must rank as one of the most interesting software engineering experiments performed to date.
Converting between IFPUG & COSMIC function point counts
Replication, repeating an experiment to confirm the results of previous experiments, is not a common activity in software engineering. Everybody wants to write about their own ideas and academic journals want to publish what is new (they are fashion driven).
Conversion between ways of counting function points, a software effort estimating technique, is one area where there has been a lot of replications (eight studies is a lot in software engineering, while a couple of hundred is a lot in psychology).
Amiri and Padmanabhuni’s Master’s thesis (yes, a thesis written by two people) lists data from 11 experiments where students/academics/professionals counted function points for a variety of projects using both the IFPUG and COSMIC counting methods. The data points are plotted below left and regression lines to each sample on the right (code+data):
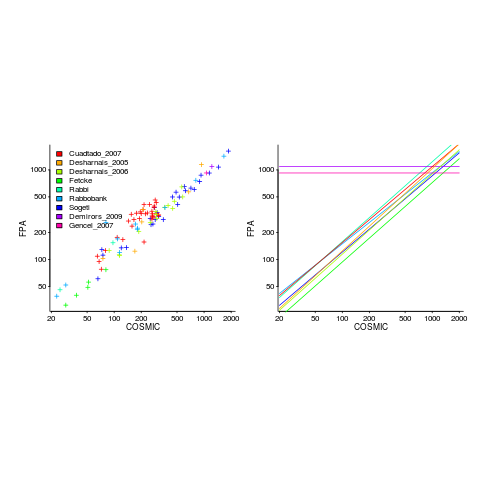
The horizontal lines are two very small samples where model fitting failed.
I was surprised to see such good agreement between different groups of counters. A study by Grimstad and Jørgensen asked developers to estimate effort (not using function points) for various projects, waited one month and repeated using what the developers thought were different projects. Most of the projects were different from the first batch, but a few were the same. The results showed developers giving completely different estimates for the same project! It looks like the effort invested in producing function point counting rules that give consistent answers and the training given to counters has paid off.
Two patterns are present in the regression lines:
- the slope of most lines is very similar, but they are offset from each other,
- the slope of some lines is obviously different from the others, with the different slopes all tilting further in the same direction. These cases mostly occur in the Cuadrado data (these three data sets are not included in the following analysis).
The kind of people doing the counting, for each set of measurements, is known and this information can be used to build a more sophisticated model.
Specifying a regression model to fit requires making several decisions about the kinds of uncertainty error present in the data. I have no experience with function points and in the following analysis I list the options and pick the one that looks reasonable to me. Please let me know if you have theory or data one suggesting what the right answer might be, I’m just juggling numbers here.
First we have to decide whether measurement error is additive or multiplicative. In other words, is there a fixed amount of potential error on each measurement, or is the amount of error proportional to the size of the project being measured (i.e., the error is a percentage of the total).
Does it make a difference to the fitted model? Sometimes it does and its always worthwhile to try building a model that mimics reality. If I tell you that  (Greek lower-case epsilon) is the symbol used to denote measurement error, you should be able to figure out which of the following two equations was built assuming additive/multiplicative error (confidence intervals have been omitted to keep things simple, they are given at the end of this post).
log(CFP)}*e^{0.81IFPi-0.6CFPi}*e^{0.24stu}+epsilon")
log(CFP)}*e^{0.83IFPi}*e^{0.29stu}*epsilon")
where:  is 0 when the IFPUG counting is done by academics and 1 when done by industry,
  is 0 when the COSMIC counting is done by academics and 1 when done by industry,
  is 1 when the counting was done by students and 0 otherwise.
I think that measurement error is multiplicative for his problem and the remaining discussion is based on this assumption. Everything after the first exponential can be treated as effectively a constant, say  , giving:
log(CFP)}*K")
If we are only interested in converting counts performed by industry we get:

If we are using academic counters the equation is:

Next we have to decide where the uncertainty error resides. Nearly all forms of regression modeling assume that all the uncertainty resides in the response variable and that there is no uncertainty in the explanatory variables are measured without uncertainty. The idea is that the values of the explanatory variables are selected by the person doing the measurement, a handle gets turned and out pops the value of the response variable, plus error, for those particular, known, explanatory variable.
The measurements in this analysis were obtained by giving the subjects a known project specification, getting them to turn a handle and recording the function point count that popped out. So all function point counts contain uncertainty error.
Does the choice of response variable make that big a difference?
Let’s take the model fitted above and do some algebra to invert it, so that COSMIC is expressed in terms of IFPUG. We get the equation:

Now lets fit a model where the roles of response/explanatory variable are switched, we get:

For this problem we need to fit a model that includes uncertainty in both variables containing function point counts. There are techniques for building models from scratch, known as errors-in-variables models. I like the SIMEX approach because it integrates well with existing R functionality for building regression models.
To use the simex function, from the R simex package, I have to decide how much uncertainty (in the form of a value for standard deviation) is present in the explanatory variable (the COSMIC counts in this case). Without any knowledge to guide the choice, I decided that the amount of error in both sets of count measurements is the same (a standard deviation of 3%, please let me know if you have a better idea).
The fitted equation for a model containing uncertainty in both counts is (see code+data for model details):

If I am interested in converting IFPUG counts to COSMIC, then what is the connection between the above model and reality?
I’m guessing that those most likely to perform conversions are in industry. Does this mean we can delete the academic subexpressions from the model, or perhaps fit a model that excludes counts made by academics? Is the Cuadrado data sufficiently different to be treated as an outlier than should be excluded from the model building process, or is it representative of an industry usage that does not occur in the available data?
There are not many industry only counts in the combined data. Perhaps the academic counters are representative of counters in industry that happen not to be included in the samples. We could build a mixed-effects model, using all the data, to get some idea of the variation between different sets of counters.
The 95% confidence intervals for the fitted exponent coefficient, using this data, is around 8%. So in practice, some of the subtitles in the above analysis are lost in the noise. To get tighter confidence bounds more data is needed.
To if-else-if or if-if, that is the question
I am currently measuring if-statements, occurring in visible source, that might be mapped to an equivalent switch-statement. The most obvious usage to look for is a sequence of if-else-if statements that all involve the same expression being tested against an integer constant, as in
if (x == 1) stmt_1; else if (x == 2) stmt_2; else if (x == 3) stmt_3; |
Another possible sequence is:
if (x == 1) stmt_1; if (x == 2) stmt_2; if (x == 3) stmt_3; |
provided all but the last conditionally executed arms do not change the value of the common control variable (e.g., x).
I started to wonder about what would cause a developer to chose one of these forms over the other. Perhaps the if-if form would be used when it was obvious that the common conditional variable was not modified in the conditionally executed arm. This would imply that there would be more statements in the arms of if-else-if sequences than if-if sequences. The following plot of percentage occurrence (over all detected if-else-if/if-if forms) of line number difference between pars of associated if-statements (e.g., when the controlling expression occurs on line
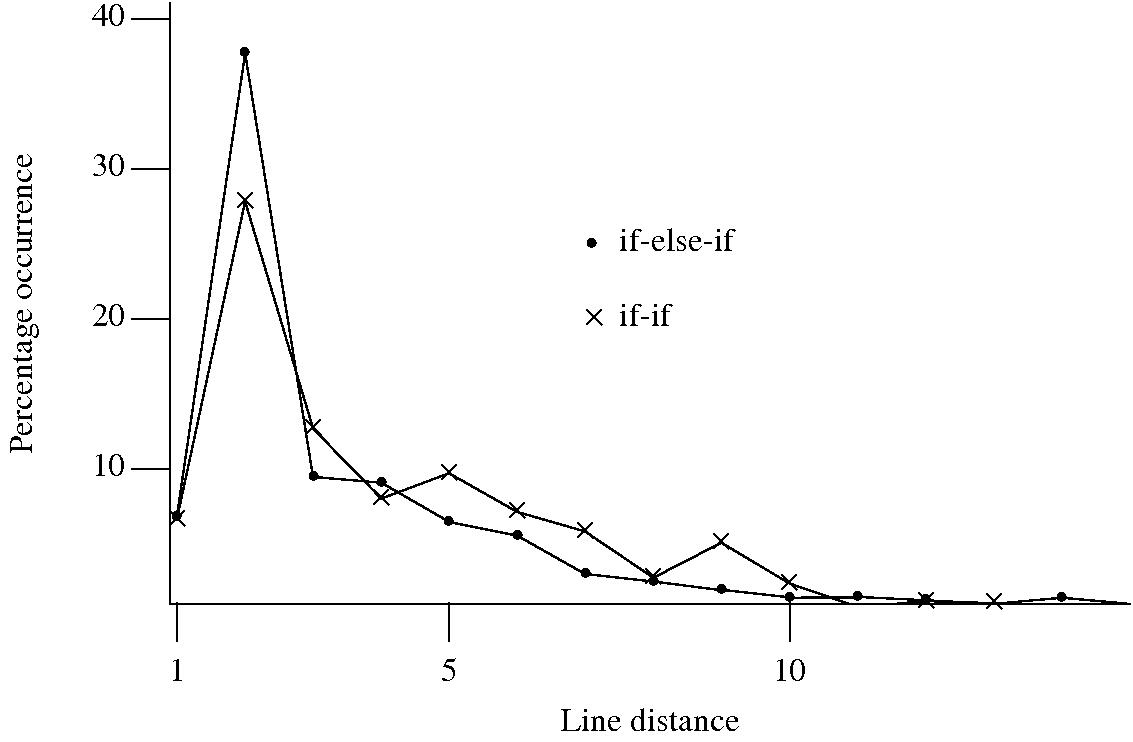
Just over a quarter of the arms contain a single statement (or to be exact the code is contained on a single line); this suggests that when using the if-else-if form most developers put the else and if on the same line. At the next distance along the percentage of if-else-if forms is twice as great as the if-if, probably because of else and if appearing on separate lines (as in the introductory example) in one case and less frequently a comment/blank line in the other. Next along, why the big increase in if-if forms? A comment + blank line, or perhaps no comment or blank line but the use of curly brackets (this is too off the track of where I am supposed to be going to investigate).
This morning I realized why the original plot did not look right, one of the data sets was a way off adding to 100%. An updated version has been uploaded.
It turns out that a single statement (or at least a single line) is more common in the if-else-if form, the opposite of what I had expected. At slightly larger distances there are still differences that can be attributed to else and if appearing on separate lines, curly brackets and a comment/blank line, but the effect is not as large as seen in the original, less accurate, plot.
I have a feeling that I ought to say something about the if-else-if form being preferred to the if-if form. One of the forms will have its behavior changed if the common control variable is modified in one of its arms. But is this an intended or unintended behavior? What is the typical characteristic usage of a common control variable, e.g., do they tend to be accessed but not modified in a given function definition? At the moment I see no obvious cost or benefit strongly favoring one usage over the other, so I will remain silent on the issue.
Implementing the between operation
What code do developers write to check whether a value lies between two bounds (i.e., a between operation)? I would write (where MIN and MAX might be symbolic names or numeric literals):
if ( x >= MIN && x <= MAX ) |
that is I would check the lowest value first. Performing the test in this order just seems the natural thing to do, perhaps because I live in a culture that writes left to write and a written sequence of increasing numbers usually has the lowest number on the left.
I am currently measuring various forms of if-statement conditional expressions that occur in visible source as part of some research on if/switch usage by developers and the between operation falls within the set of expressions of interest. I was not expecting to see any usage of the form:
if ( x <= MAX && x >= MIN ) |
that is with the maximum value appearing first. The first program measured threw up seven instances of this usage, all with the minimum value being negative and in five cases the maximum value being zero. Perhaps left to right ordering still applied, but to the absolute value of the bounds.
Measurements of the second and subsequent programs threw up instances that did not follow any of the patterns I had dreamt up. Of the 326 between operations appearing in the measured source 24 had what I consider to be the unnatural order. Presumably the developers using this form of between consider it to be natural, so what is their line of thinking? Are they thinking in terms of the semantics behind the numbers (in about a third of cases symbolic constants appear in the source rather than literals) and this semantics has an implied left to right order? Perhaps the authors come from a culture where the maximum value often appears on the left.
Suggestions welcome.
Readability, an experimental view
Readability is an attribute that source code is often claimed to have, but what is it? While people are happy to use the term they have great difficulty in defining exactly what it is (I will eventually get around discussing my own own views in post). Ray Buse took a very simply approach to answering this question, he asked lots of people (to be exact 120 students) to rate short snippets of code and analysed the results. Like all good researchers he made his data available to others. This posting discusses my thoughts on the expected results and some analysis of the results.
The subjects were first, second, third year undergraduates and postgraduates. I would not expect first year students to know anything and for their results to be essentially random. Over the years, as they gain more experience, I would expect individual views on what constitutes readability to stabilize. The input from friends, teachers, books and web pages might be expected to create some degree of agreement between different students’ view of what constitutes readability. I’m not saying that this common view is correct or bears any relationship to views held by other groups of people, only that there might be some degree of convergence within a group of people studying together.
Readability is not something that students can be expected to have explicitly studied (I’m assuming that it plays an insignificant part in any course marks), so their knowledge of it is implicit. Some students will enjoy writing code and spends lots of time doing it while (many) others will not.
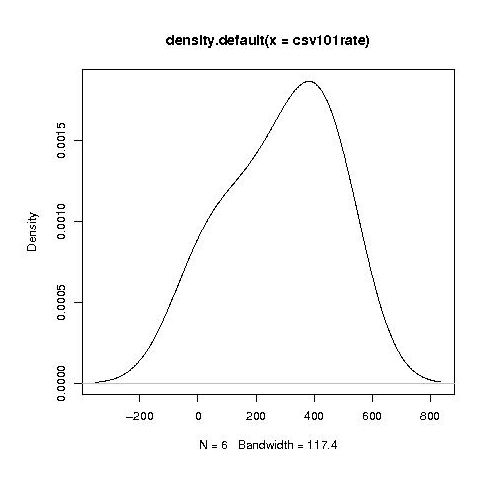
Separating out the data by year the results for first year students look like a normal distribution with a slight bulge on one side (created using plot(density(1_to_5_rating_data)) in R).
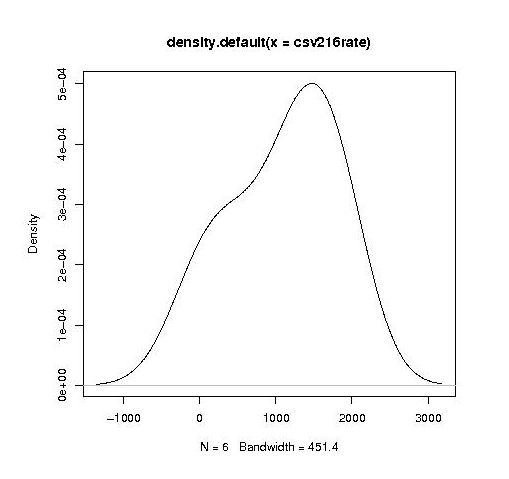
year by year this bulge turns (second year):
into a hillock (final year):
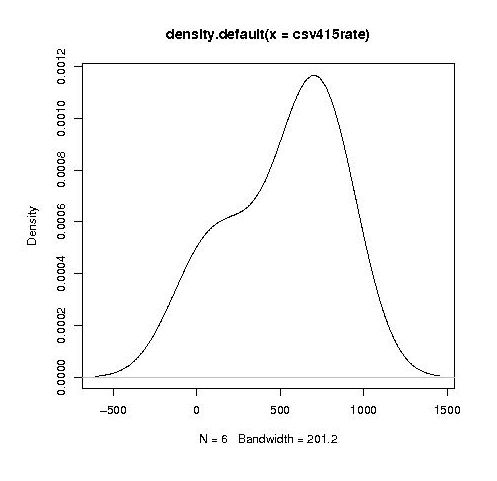
It is tempting to interpret these results as the majority of students assigning an essentially random rating, with a slight positive bias, for the readability of each snippet, with a growing number of more experienced students assigning less than average rating to some snippets.
Do the student’s view converge to a common opinion on readability? The answers appears to be No. An analysis of the final year data using Fleiss’s Kappa shows that there is virtually no agreement between students ratings. In fact every Interrater Reliability and Agreement function I tried said the same thing. Some cluster analysis might enable me to locate students holding similar views.
In an email exchange with Ray Buse I learned that the postgraduate students had a relatively wide range of computing expertise, so I did not analyse their results.
I wish I had thought of this approach to measuring readability. Its simplicity makes it amenable for use in a wide range of experimental situations. The one change I would make is that I would explicitly create the snippets to have certain properties, rather than randomly extracting them from existing source.
Parsing without a symbol table
When processing C/C++ source for the first time through a compiler or static analysis tool there are invariably errors caused by missing header files (often because the search path has not been set) or incorrectly defined, or not defined, macro names. One solution to this configuration problem is to be able to process source without handling preprocessing directives (e.g., skipping them, such as not reading the contents of header files or working out which arm of a conditional directive is applicable). Developers can do it, why not machines?
A few years ago GLR support was added to Bison, enabling it to process ambiguous grammars, and I decided to create a C parser that simply skipped all preprocessing directives. I knew that at least one reasonably common usage would generate a syntax error:
func_call(a, #if SOME_FLAG b_1); #else b_2); #endif |
c);
and wanted to minimize its consequences (i.e., cascading syntax errors to the end of the file). The solution chosen was to parse the source a single statement or declaration at a time, so any syntax error would be localized to a single statement or declaration.
Systems for parsing ambiguous grammars work on the basis that while the input may be locally ambiguous, once enough tokens have been seen the number of possible parses will be reduced to one. In C (and even more so in C++) there are some situations where it is impossible to resolve which of several possible parses apply without declaration information on one or more of the identifiers involved (a traditional parser would maintain a symbol table where this information could be obtained when needed). For instance, x * y; could be a declaration of the identifier y to have type x or an expression statement that multiplies x and y. My parser did not have a symbol table and even if it did the lack of header file processing meant that its contents would only contain a partial set of the declared identifiers. The ambiguity resolution strategy I adopted was to pick the most likely case, which in the example is the declaration parse.
Other constructs where the common case (chosen by me and I have yet to get around to actually verifying via measurement) was used to resolve an ambiguity deadlock included:
f(p); // Very common, // confidently picked function call as the common case (m)*p; // Not rare, // confidently picked multiplication as the common case (s) - t; // Quiet rare, // picked binary operator as the common case (r) + (s) - t; // Very rare, //an iteration on the case above |
At the moment I am using the parser to measure language usage, so less than 100% correctness can be tolerated. Some of the constructs that cause a syntax error to be generated every few hundred statement/declarations include:
offsetof(struct tag, field_name) // Declarators cannot be //function arguments int f(p, q) int p; // Tries to reduce this as a declaration without handling char q; // it as part of an old style function definition { MACRO(+); // Preprocessing expands to something meaningful |
Some of these can be handled by extensions to the grammar, while others could be handled by an error recovery mechanism that recognized likely macro usage and inserted something appropriate (e.g., a dummy expression in the MACRO(x) case).
Recent Comments