Archive
The wind is not yet blowing in software engineering research
An article by Andrew Gelman is getting a lot of well deserved publicity at the moment. The topic of discussion is sloppy research practices in psychology and how researchers are responding to criticism (head in the sand and blame the messenger).
I imagine that most software developers think this is an intrinsic problem in the ‘soft’ sciences that does not apply to the ‘hard’ sciences, such as software; I certainly thought this until around 2000 or so. Writing a book containing a detailed analysis of C convinced me that software engineering was mostly opinion, with a tiny smattering of knowledge in places.
The C book tried to apply results from cognitive psychology to what software developers do. After reading lots of books and papers on cognitive psychology I was impressed with how much more advanced, and rigorous, their experimental methods were, compared to software engineering.
Writing a book on empirical software engineering has moved my views on to the point where I think software engineering is the ideal topic for the academic fraudster.
The process of cleaning up their act that researchers in psychology are going through now is something that software engineering will have to go through. Researchers have not yet reached the stage of directly pointing out that software engineering research is a train wreck. Instead, they write parody papers and polite article showing how dirty popular datasets are.
Of course, industry is happy to keep quiet. The development of software systems is still a sellers market (the packaged market is dog eat dog) or at least that is still the prevalent mentality. I doubt anything much will change until the production of software systems becomes a buyers market, which will create a real incentive for finding out what really works.
Converting between IFPUG & COSMIC function point counts
Replication, repeating an experiment to confirm the results of previous experiments, is not a common activity in software engineering. Everybody wants to write about their own ideas and academic journals want to publish what is new (they are fashion driven).
Conversion between ways of counting function points, a software effort estimating technique, is one area where there has been a lot of replications (eight studies is a lot in software engineering, while a couple of hundred is a lot in psychology).
Amiri and Padmanabhuni’s Master’s thesis (yes, a thesis written by two people) lists data from 11 experiments where students/academics/professionals counted function points for a variety of projects using both the IFPUG and COSMIC counting methods. The data points are plotted below left and regression lines to each sample on the right (code+data):
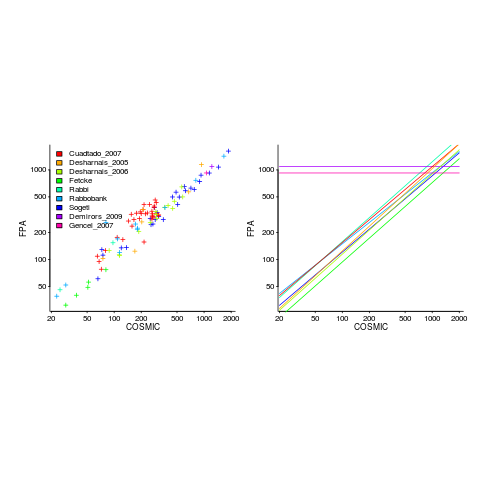
The horizontal lines are two very small samples where model fitting failed.
I was surprised to see such good agreement between different groups of counters. A study by Grimstad and Jørgensen asked developers to estimate effort (not using function points) for various projects, waited one month and repeated using what the developers thought were different projects. Most of the projects were different from the first batch, but a few were the same. The results showed developers giving completely different estimates for the same project! It looks like the effort invested in producing function point counting rules that give consistent answers and the training given to counters has paid off.
Two patterns are present in the regression lines:
- the slope of most lines is very similar, but they are offset from each other,
- the slope of some lines is obviously different from the others, with the different slopes all tilting further in the same direction. These cases mostly occur in the Cuadrado data (these three data sets are not included in the following analysis).
The kind of people doing the counting, for each set of measurements, is known and this information can be used to build a more sophisticated model.
Specifying a regression model to fit requires making several decisions about the kinds of uncertainty error present in the data. I have no experience with function points and in the following analysis I list the options and pick the one that looks reasonable to me. Please let me know if you have theory or data one suggesting what the right answer might be, I’m just juggling numbers here.
First we have to decide whether measurement error is additive or multiplicative. In other words, is there a fixed amount of potential error on each measurement, or is the amount of error proportional to the size of the project being measured (i.e., the error is a percentage of the total).
Does it make a difference to the fitted model? Sometimes it does and its always worthwhile to try building a model that mimics reality. If I tell you that  (Greek lower-case epsilon) is the symbol used to denote measurement error, you should be able to figure out which of the following two equations was built assuming additive/multiplicative error (confidence intervals have been omitted to keep things simple, they are given at the end of this post).
log(CFP)}*e^{0.81IFPi-0.6CFPi}*e^{0.24stu}+epsilon")
log(CFP)}*e^{0.83IFPi}*e^{0.29stu}*epsilon")
where:  is 0 when the IFPUG counting is done by academics and 1 when done by industry,
  is 0 when the COSMIC counting is done by academics and 1 when done by industry,
  is 1 when the counting was done by students and 0 otherwise.
I think that measurement error is multiplicative for his problem and the remaining discussion is based on this assumption. Everything after the first exponential can be treated as effectively a constant, say  , giving:
log(CFP)}*K")
If we are only interested in converting counts performed by industry we get:

If we are using academic counters the equation is:

Next we have to decide where the uncertainty error resides. Nearly all forms of regression modeling assume that all the uncertainty resides in the response variable and that there is no uncertainty in the explanatory variables are measured without uncertainty. The idea is that the values of the explanatory variables are selected by the person doing the measurement, a handle gets turned and out pops the value of the response variable, plus error, for those particular, known, explanatory variable.
The measurements in this analysis were obtained by giving the subjects a known project specification, getting them to turn a handle and recording the function point count that popped out. So all function point counts contain uncertainty error.
Does the choice of response variable make that big a difference?
Let’s take the model fitted above and do some algebra to invert it, so that COSMIC is expressed in terms of IFPUG. We get the equation:

Now lets fit a model where the roles of response/explanatory variable are switched, we get:

For this problem we need to fit a model that includes uncertainty in both variables containing function point counts. There are techniques for building models from scratch, known as errors-in-variables models. I like the SIMEX approach because it integrates well with existing R functionality for building regression models.
To use the simex function, from the R simex package, I have to decide how much uncertainty (in the form of a value for standard deviation) is present in the explanatory variable (the COSMIC counts in this case). Without any knowledge to guide the choice, I decided that the amount of error in both sets of count measurements is the same (a standard deviation of 3%, please let me know if you have a better idea).
The fitted equation for a model containing uncertainty in both counts is (see code+data for model details):

If I am interested in converting IFPUG counts to COSMIC, then what is the connection between the above model and reality?
I’m guessing that those most likely to perform conversions are in industry. Does this mean we can delete the academic subexpressions from the model, or perhaps fit a model that excludes counts made by academics? Is the Cuadrado data sufficiently different to be treated as an outlier than should be excluded from the model building process, or is it representative of an industry usage that does not occur in the available data?
There are not many industry only counts in the combined data. Perhaps the academic counters are representative of counters in industry that happen not to be included in the samples. We could build a mixed-effects model, using all the data, to get some idea of the variation between different sets of counters.
The 95% confidence intervals for the fitted exponent coefficient, using this data, is around 8%. So in practice, some of the subtitles in the above analysis are lost in the noise. To get tighter confidence bounds more data is needed.
Designing a processor for increased source portability costs
How might a vendor make it difficult for developers to port open source applications to their proprietary cpu? Keeping the instruction set secret is one technique, another is to design a cpu that breaks often relied upon assumptions that developers have about the characteristics of the architecture on which their code executes.
Of course breaking architectural assumptions does not prevent open source being ported to a platform, but could significantly slow down the migration; giving more time for customers to become locked into the software shipped with the product.
Which assumptions should be broken to have the maximum impact on porting open source? The major open source applications (e.g., Firefox, MySQL, etc) run on 32/64-bit architectures that have an unsigned address space, whose integer representation uses two’s complement arithmetic and arithmetic operations on these integer values wrap on over/underflow.
32/64-bit. There is plenty of experience showing that migrating code from 16-bit to 32-bit environments can involve a lot of effort (e.g., migrating Windows 286/386 code to the Intel 486) and plenty of companies are finding the migration from 32 to 64-bits costly.
Designing a 128-bit processor might not be cost effective, but what about a 40-bit processor, like a number of high end DSP chips? I suspect that there are many power-of-2 assumptions lurking in a lot of code. A 40-bit integer type could prove very expensive for ports of code written with a 32/64-bit mindset (dare I suggest a 20-bit short; DSP vendors have preferred 16-bits because it uses less storage?).
Unsigned address space (i.e., lowest address is zero). Some code assumes that addresses with the top bit set are at the top end of memory and not just below the middle (e.g., some garbage collectors). Processors having a signed address space (i.e., zero is in the middle of storage) are sufficiently rare (e.g., the Inmos Transputer) that source is unlikely to support a HAS_SIGNED_ADDRESS build option.
How much code might need to be rewritten? I have no idea. While the code is likely to be very important there might not be a lot of it.
Two’s complement. Developers are constantly told not to write code that relies on the internal representation of data types. However, they might be forgiven for thinking that nobody uses anything other than two’s complement to represent integer types these days (I suspect Univac does not have that much new code ported to it’s range of one’s complement machines).
How much code will break when ported to a one’s complement processor? The representation of negative numbers in one’s complement and two’s complement is different and the representation of positive numbers the same. In common usage positive values are significantly more common than negative values and many variables (having a signed type) never get to hold a negative value.
While I have no practical experience, or know of anybody who has, I suspect the use of one’s complement might not be that big a problem. If you have experience please comment.
Arithmetic that wraps (i.e., positive values overflow negative and negative values underflow positive). While expressions explicitly written to wrap might be rare, how many calculations contain intermediate values that have wrapped but deliver a correct final result because they are ‘unwrapped’ by a subsequent operation?
Arithmetic operation that saturate are needed in applications such as graphics where, for instance, increasing the brightness should not suddenly cause the darkest setting to occur. Some graphics processors include support for arithmetic operations that saturate.
The impact of saturation arithmetic on portability is difficult to judge. A lot of code contains variables having signed char and short types, but when they appear as the operand in a binary operation these are promoted to int in C/C++/etc which probably has sufficient range not to overflow (most values created during program execution are small). Again I am lacking in practical experience and comments are welcome.
Floating-point. Many programs do not make use of floating-point arithmetic and those that do rarely manipulate such values at the bit level. Using a non-IEEE 754 floating-point representation will probably have little impact on the portability of applications of interest to most users.
Update. Thanks to Cate for pointing out that I had forgotten to discuss why using non-8-bit chars does is not a worthwhile design decision.
Both POSIX and the C/C++ Standards require that the char type be represented in at least 8 bits. Computers supporting less than 8-bits were still being used in the early 80s (e.g., the much beloved ICL 1900 supported 6-bit characters). The C Standard also requires that char be the smallest unit of addressable storage, which means that it must be possible for a pointer to point at an object having a char type.
Designing a processor where the smallest unit of storage is greater than 8-bits but not a power-of-2 is likely to substantially increase all sorts of costs and complicate things enormously (e.g., interfaces to main memory which are designed to work with power of two interfaces). The purpose of this design is to increase other people’s cost, not the proprietary vendor’s cost.
What about that pointer requirement? Perhaps the smallest unit of storage that a pointer could address might be 16 or 40 bits? Such processors exist and compiler writers have used both solutions to the problems they present. One solution is for a pointer to contain the address of the storage location + offset of the byte within that storage (Cray used this approach on a processor whose pointers could only point at 64-bit chunks of storage, with the compiler generating the code to extract the appropriate byte), the other is to declare that the char type occupies 40-bits (several DSP compilers have taken this approach).
Having the compiler declare that char is not 8-bits wide would cause all sorts of grief, so lets not go there. What about the Cray compiler approach?
Some of the address bits on 64-bit processors are not used yet (because few customers need that amount of storage) so compiler writers could get around host-processor pointers not supporting the granularity needed to point at 8-bit objects by storing the extra information in ‘unused’ pointer bits (the compiler generating the appropriate insertion and extraction code). The end result is that the compiler can hide pointer addressability issues :-).
Benford’s law and numeric literals in source code
Benford’s law applies to values derived from a surprising number of natural and man-made processes. I was very optimistic that it would also apply to numeric literals in source code. Measurements of C source showed that I was wrong (the chi-square fit was 1,680 for decimal integer literals and 132,398 for floating literals).
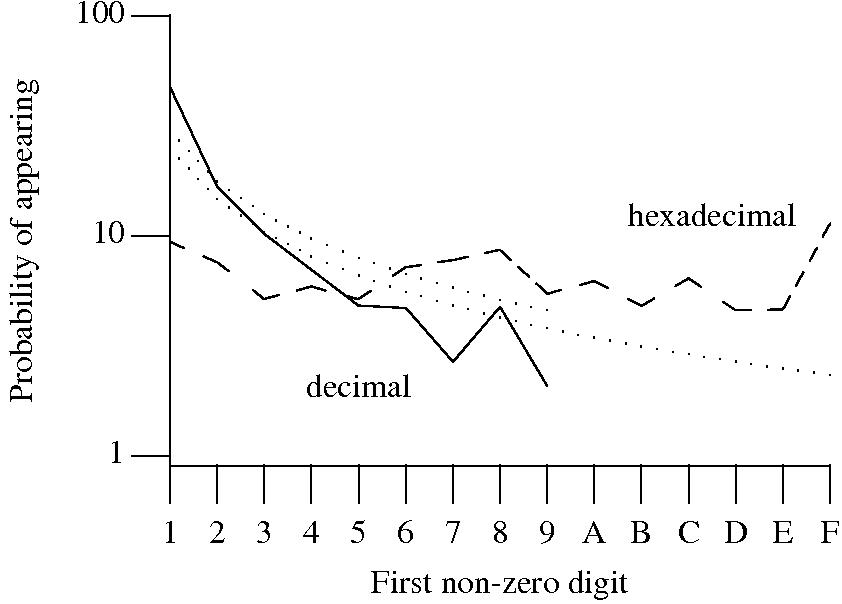
Probability that the leading digit of an (decimal or hexadecimal) integer literal has a particular value (dotted lines predicted by Benford’s law).
What are the conditions necessary for a sample of values to follow Benford’s law? A number of circumstances have been found to result in sample values having a leading digit that follows Benford’s law, including:
Samples that have been found to follow Benford’s law include lists of physical constants and accounting data (so much so that it has been used to detect accounting fraud). However, the number of data-sets containing values whose leading digit follows Benford’s law is not a great as some would make us believe.
Why don’t the leading digits of numeric literals in source code follow Benford’s law?
++/-- operators reduces the number of instances of 1 to increment/decrement a value). But this only applies to integer types, not floating types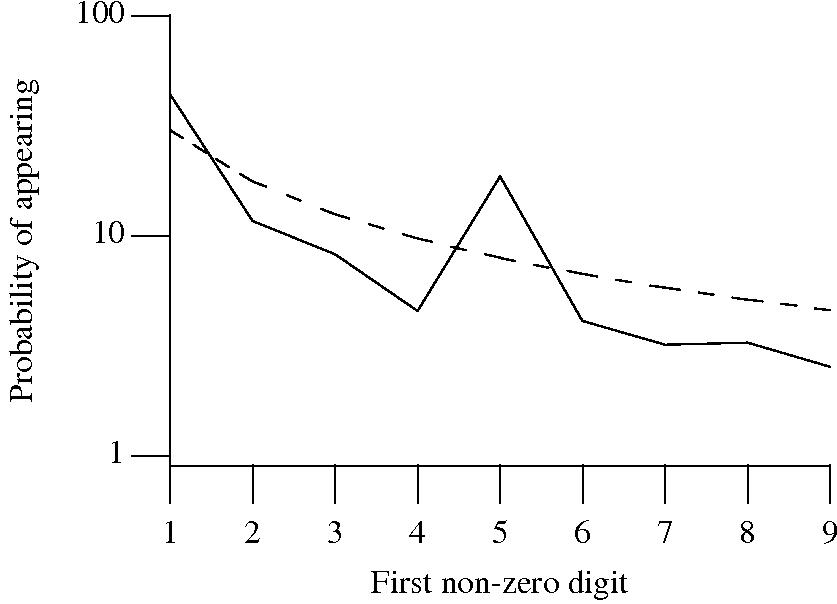
Probability that the leading, first non-zero, digit of a floating literal has a particular value (dashed line predicted by Benford’s law).
5 for the floating-point literals? Have values been rounded to produce 0.5? This looks like an area where methods used for accounting fraud detection might be applied (not that any fraud is implied, just irregularity).These surprising measurements show that there is a lot to the shape of numeric literals that is yet to be discovered.
Using third party measurement data
Until today, to the best of my knowledge, all the source code analysis papers I have read were written by researchers who had control of the code analysis tools they used and had some form of localised access to the source. By control of the code analysis tools I mean that the researchers specified the tool options and had the ability to check the behavior of the tool, in many cases the source of the tool was available to them and often even written by them, and the localised access may have involved downloading lots of code from the web.
I have just been reading about a broad brush analysis of comment usage based on data provided by a commercial code repository that offers API access to some basic code metrics.
At first, I was very frustrated by the lack of depth to the analysis provided in the paper, but then I realised that the authors’ intent was to investigate a few broad ideas about comment usage in a large number of projects (around 10,000). The authors complained in their blog about some of the referees comments and having to submit a shorter paper. I can see where the referees are coming from, the papers are lacking in depth of analysis, but they do contain some interesting results.
I was very interested in Figure 2:
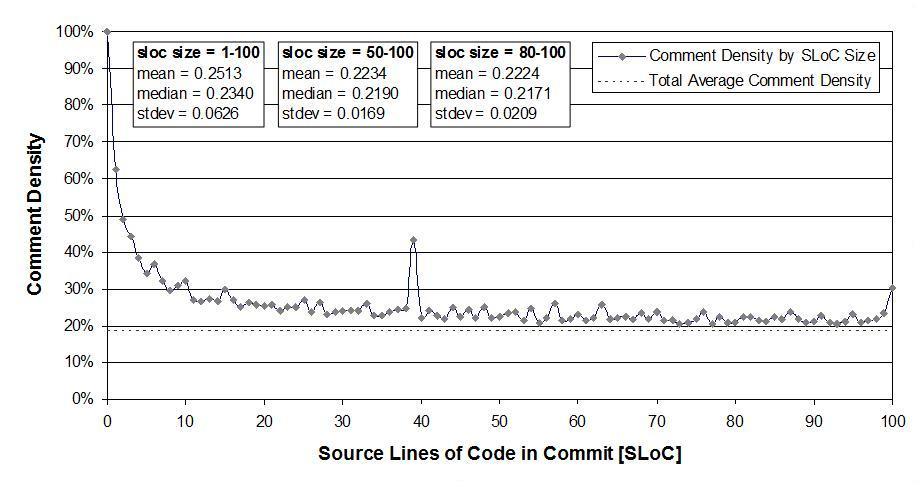
which plots the comment density of the lines in a source code commit. I would expect the ratio to be higher for small commits because a developer probably has a relatively fixed amount to say about updates involving a smallish number of lines (which probably fixes a problem). Larger commits are probably updated functionality and so would have a comment density similar to the ‘average’.
The problem with relying on third parties to supply the data is that obtaining the answers to follow up questions invariably involves lots of work, e.g., creating an environment to perform the measurements needed for the follow-up questions. However, the third party approach can significantly reduce the amount of work needed to get to a point where the interestingness of the results can be gauged.