Top, must-read paper on software fault analysis
What is the top, must read, paper on software fault analysis?
Software Reliability: Repetitive Run Experimentation and Modeling by Phyllis Nagel and James Skrivan is my choice (it’s actually a report, rather than a paper). Not only is this report full of interesting ideas and data, but it has multiple replications. Replication of experiments in software engineering is very rare; this work was replicated by the original authors, plus Scholz, and then replicated by Janet Dunham and John Pierce, and then again by Dunham and Lauterbach!
I suspect that most readers have never heard of this work, or of Phyllis Nagel or James Skrivan (I hadn’t until I read the report). Being published is rarely enough for work to become well-known, the authors need to proactively advertise the work. Nagel, Dunham & co worked in industry and so did not have any students to promote their work and did not spend time on the academic seminar circuit. Given enough effort it’s possible for even minor work to become widely known.
The study run by Nagel and Skrivan first had three experienced developers independently implement the same specification. Each of these three implementations was then tested, multiple times. The iteration sequence was: 1) run program until fault experienced, 2) fix fault, 3) if less than five faults experienced, goto step (1). The measurements recorded were fault identity and the number of inputs processed before the fault was experienced.
This process was repeated 50 times, always starting with the original (uncorrected) implementation; the replications varied this, along with the number of inputs used.
For a fault to be experienced, there has to be a mistake in the code and the ‘right’ input values have to be processed.
How many input values need to be processed, on average, before a particular fault is experienced? Does the average number of inputs values needed for a fault experience vary between faults, and if so by how much?
The plot below (code+data) shows the numbers of inputs processed, by one of the implementations, before individual faults were experienced, over 50 runs (sorted by number of inputs):
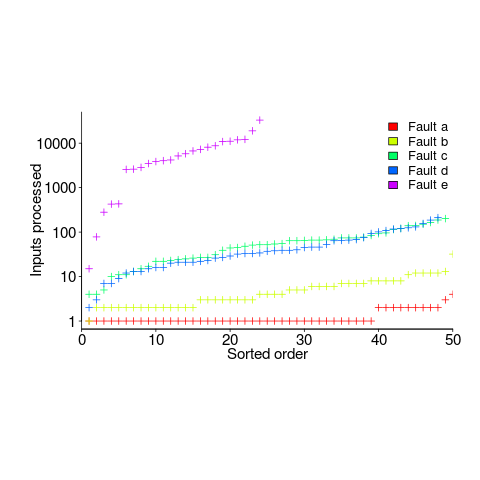
Different faults have different probabilities of being experienced, with fault a being experienced on almost any input and fault e occurring much less frequently (a pattern seen in the replications). There is an order of magnitude variation in the number of inputs processed before particular faults are experienced (this pattern is seen in the replications).
Faults were fixed as soon as they were experienced, so the technique for estimating the total number of distinct faults, discussed in a previous post, cannot be used.
A plot of number of faults found against number of inputs processed is another possibility. More on that another time.
Suggestions for top, must read, paper on software faults, welcome (be warned, I think that most published fault research is a waste of time).
Recent Comments