Converting between IFPUG & COSMIC function point counts
Replication, repeating an experiment to confirm the results of previous experiments, is not a common activity in software engineering. Everybody wants to write about their own ideas and academic journals want to publish what is new (they are fashion driven).
Conversion between ways of counting function points, a software effort estimating technique, is one area where there has been a lot of replications (eight studies is a lot in software engineering, while a couple of hundred is a lot in psychology).
Amiri and Padmanabhuni’s Master’s thesis (yes, a thesis written by two people) lists data from 11 experiments where students/academics/professionals counted function points for a variety of projects using both the IFPUG and COSMIC counting methods. The data points are plotted below left and regression lines to each sample on the right (code+data):
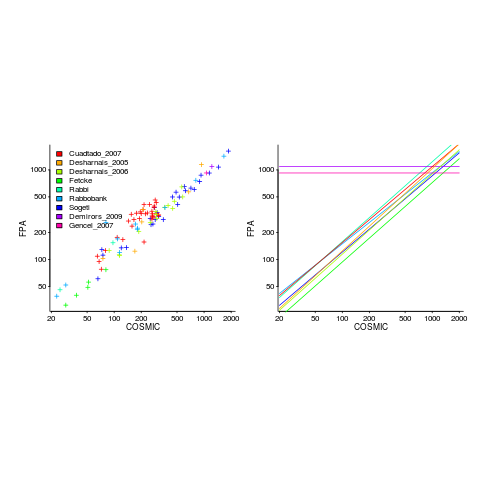
The horizontal lines are two very small samples where model fitting failed.
I was surprised to see such good agreement between different groups of counters. A study by Grimstad and Jørgensen asked developers to estimate effort (not using function points) for various projects, waited one month and repeated using what the developers thought were different projects. Most of the projects were different from the first batch, but a few were the same. The results showed developers giving completely different estimates for the same project! It looks like the effort invested in producing function point counting rules that give consistent answers and the training given to counters has paid off.
Two patterns are present in the regression lines:
- the slope of most lines is very similar, but they are offset from each other,
- the slope of some lines is obviously different from the others, with the different slopes all tilting further in the same direction. These cases mostly occur in the Cuadrado data (these three data sets are not included in the following analysis).
The kind of people doing the counting, for each set of measurements, is known and this information can be used to build a more sophisticated model.
Specifying a regression model to fit requires making several decisions about the kinds of uncertainty error present in the data. I have no experience with function points and in the following analysis I list the options and pick the one that looks reasonable to me. Please let me know if you have theory or data one suggesting what the right answer might be, I’m just juggling numbers here.
First we have to decide whether measurement error is additive or multiplicative. In other words, is there a fixed amount of potential error on each measurement, or is the amount of error proportional to the size of the project being measured (i.e., the error is a percentage of the total).
Does it make a difference to the fitted model? Sometimes it does and its always worthwhile to try building a model that mimics reality. If I tell you that  (Greek lower-case epsilon) is the symbol used to denote measurement error, you should be able to figure out which of the following two equations was built assuming additive/multiplicative error (confidence intervals have been omitted to keep things simple, they are given at the end of this post).
log(CFP)}*e^{0.81IFPi-0.6CFPi}*e^{0.24stu}+epsilon")
log(CFP)}*e^{0.83IFPi}*e^{0.29stu}*epsilon")
where:  is 0 when the IFPUG counting is done by academics and 1 when done by industry,
  is 0 when the COSMIC counting is done by academics and 1 when done by industry,
  is 1 when the counting was done by students and 0 otherwise.
I think that measurement error is multiplicative for his problem and the remaining discussion is based on this assumption. Everything after the first exponential can be treated as effectively a constant, say  , giving:
log(CFP)}*K")
If we are only interested in converting counts performed by industry we get:

If we are using academic counters the equation is:

Next we have to decide where the uncertainty error resides. Nearly all forms of regression modeling assume that all the uncertainty resides in the response variable and that there is no uncertainty in the explanatory variables are measured without uncertainty. The idea is that the values of the explanatory variables are selected by the person doing the measurement, a handle gets turned and out pops the value of the response variable, plus error, for those particular, known, explanatory variable.
The measurements in this analysis were obtained by giving the subjects a known project specification, getting them to turn a handle and recording the function point count that popped out. So all function point counts contain uncertainty error.
Does the choice of response variable make that big a difference?
Let’s take the model fitted above and do some algebra to invert it, so that COSMIC is expressed in terms of IFPUG. We get the equation:

Now lets fit a model where the roles of response/explanatory variable are switched, we get:

For this problem we need to fit a model that includes uncertainty in both variables containing function point counts. There are techniques for building models from scratch, known as errors-in-variables models. I like the SIMEX approach because it integrates well with existing R functionality for building regression models.
To use the simex function, from the R simex package, I have to decide how much uncertainty (in the form of a value for standard deviation) is present in the explanatory variable (the COSMIC counts in this case). Without any knowledge to guide the choice, I decided that the amount of error in both sets of count measurements is the same (a standard deviation of 3%, please let me know if you have a better idea).
The fitted equation for a model containing uncertainty in both counts is (see code+data for model details):

If I am interested in converting IFPUG counts to COSMIC, then what is the connection between the above model and reality?
I’m guessing that those most likely to perform conversions are in industry. Does this mean we can delete the academic subexpressions from the model, or perhaps fit a model that excludes counts made by academics? Is the Cuadrado data sufficiently different to be treated as an outlier than should be excluded from the model building process, or is it representative of an industry usage that does not occur in the available data?
There are not many industry only counts in the combined data. Perhaps the academic counters are representative of counters in industry that happen not to be included in the samples. We could build a mixed-effects model, using all the data, to get some idea of the variation between different sets of counters.
The 95% confidence intervals for the fitted exponent coefficient, using this data, is around 8%. So in practice, some of the subtitles in the above analysis are lost in the noise. To get tighter confidence bounds more data is needed.
I think the following study could be of interest to you:
Peter Kampstra and Chris Verhoef authored a report on “Reliability of function point counts.” The research was partially sponsored by the Dutch Ministry of Economic Affairs. The research is based on a software portfolio of 311 projects and 58143 function points.
The report is freely available at https://www.cs.vu.nl/~x/rofpc/rofpc.pdf
@Frans Badenhorst
The data from this paper appears in figure 5.20 of my Evidence-based software engineering book.