Fortran & Cobol in the USAF over the years 1955-1986
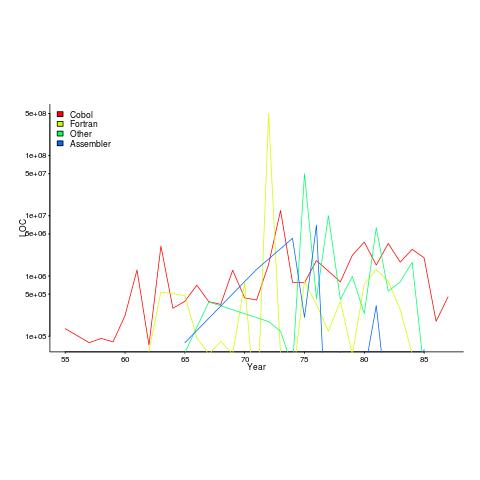
I recently discovered a new dataset from Rome’s golden age, going back to 1955. Who knew that in 1955 the US Air Force took delivery of 133,075 lines of Cobol? The plot below shows lines of code against year, broken down by major languages used.
I got the data from the Master’s thesis of Captain NeSmith II (there is probably more software engineering data to be found in US Air Force officers’ Master’s thesis than all published academic papers before 2005). Captain NeSmith got his data from the Information Systems Designator (ISD) database maintained by the Standard Information Systems Center (SISC); the data does not include classified project and embedded systems. This database contained more data than appeared in the thesis, but I cannot find it anywhere.
Given the spiky nature of the data I’m guessing that LOC and development costs are counted in the year a project is delivered. Maintenance costs are through to financial year 1984.
The big question that jumps out of the data is “What project delivered 0.5 billion lines of Fortran in 1972?”
The LOC for Assemble suspiciously does not occur before 1965.
In the 1980s people were always talking about the billion+ lines of Cobol in use by the US Government. Over the 31 year span of this USAF data, 46 million lines of Cobol were delivered at a cost of $0.5 billion. Did another 50 arms of the government produce similar amounts of Cobol? Is the USAF under/over representative of Cobol?
The plot below shows yearly LOC against development cost, plus fitted regression lines.
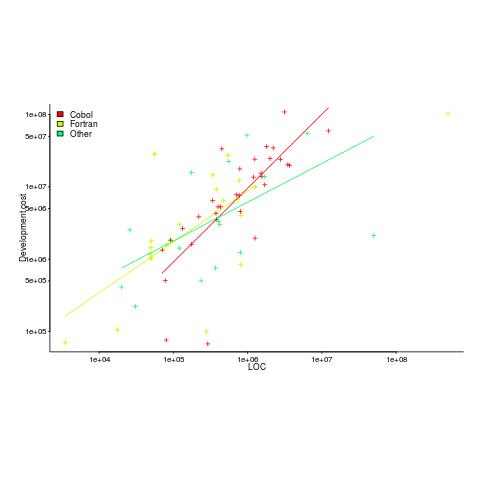
Using development cost as a proxy for effort, the coefficients of the fitted lines were close to those I fitted to Boehm’s embedded data (i.e., the exponents were lower than those listed by Boehm); Fortran 0.7, Cobol 1 and Other 0.5 (the huge Fortran outlier was excluded).
Adding Year to the regression model shows than Fortran development cost decreased by around 8% per year. Cobol may have been around 1% per year, depending on which model is chosen.
The maintenance costs can be plotted, but there is just too much uncertainty about them to say anything sensible (was inflation taken into account, how heavily used were the programs {more usage find more faults and demand for more features}, etc.).
NeSmith’s thesis contains a lot more data. The reproduction quality is not great, so the numbers have to be typed in. If you find any bugs in my data+code, please let me know and if you type in any of the other tables I would love a copy.
Recent Comments