Honking the horn for go faster memory (over go faster cpus)
I have been doing some analysis of computer performance, as measured by the results of the SPEC 2006 int benchmark (i.e, no floating point). As the following plot shows, computers are continuing to get faster (code and data):
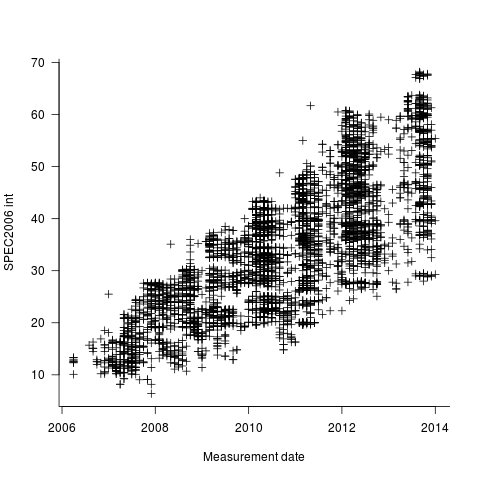
I think the widening spread of results might have a lot to do with companies slowly migrating to the newer benchmark, increasing the range of test cases; there mus also be an element of an increasing range of computer performance on offer from vendors now we have reached the good-enough point.
In the last century the increase in performance was strongly correlated with increasing cpu clock speed. As the following plot shows, this century is different (in years to come the first few years, where this correlation quickly died out, will be treated as a round-off error); performance is more likely to be higher at a higher clock rate, but far from guaranteed:
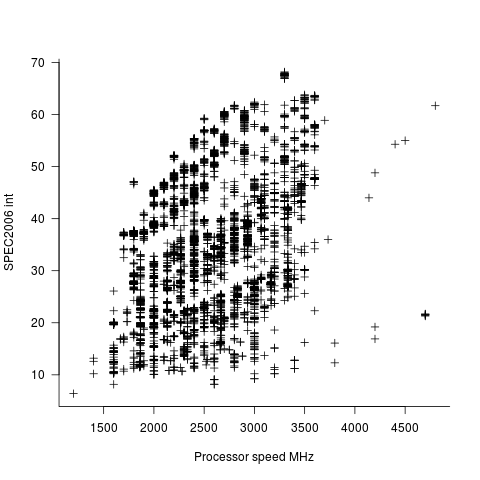
One of the reasons for this change is that, for many tasks, cpus are now seriously performance limited by memory bandwidth, and so these days a lot of the performance improvement is coming from faster memory (yes, it is really about shifting more bytes per clock tick, but a common faster/slower vocabulary keeps things simpler). The following plot uses PC2 (blue) and PC3 (red) module numbers:
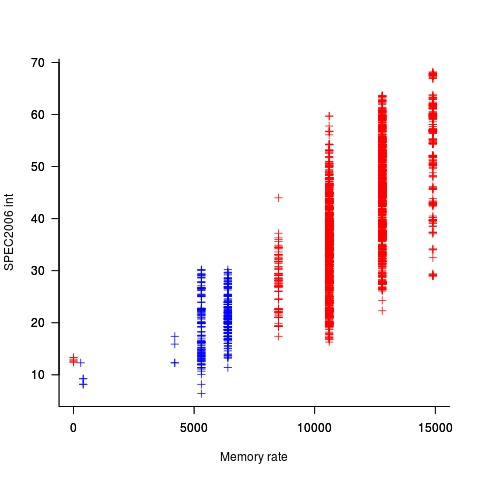
Making use of go faster memory is not as straight-forward as using a go faster cpu. Memory chip configuration includes more tuning options than cpus, which just need a faster clock. That spread in performance, for a given memory rate can probably be traced to use of different options and of course cpu caches play an important part in improving performance. The SPEC results do contain lots of descriptive details about cache characteristics, but extracting it will be fiddly and analysing this kind of stuff always makes my head hurt.
The computer buying public have learned that higher clock rate is better. Unfortunately they still think this applies to cpus when they should now be asking about memory speed. When I ask people about the speed of memory in their computer I am usually told how many gigabytes it has, or get the same kind of look I used to get many years ago when asking about cpu speed.
I think the wider spread comes from more market investment in low power chips. The inteL Atom is pretty good for less than 20W, and satisfies a lot of computing needs. On the other hand a 1.5GHz Atom is no match for a 3GHz Xeon, but the Xeon will be up around 100W and require a bigger motherboard, more fans, etc. etc. Thus, only buy the Xeon if you have genuine justification.
We kind of got past the stage where most CPUs were struggling with most of the tasks they were doing, and reached a point where the tasks that people want to do are adequately handled by the low end of the market.
With regards to memory rate, I suggest you write a simple program that grinds an algorithm over a patch of memory, then allocates a bigger patch by 50% again over the first and re-grinds the same algorithm, then continues in the same way with bigger and bigger chunks of memory. What you find is that the level-1 cache runs at the same speed as the primary CPU clock, but as soon as your patch of memory grows bigger than L1 cache you see a step down in performance as you hit L2 cache. Then it steps down again when you hit main RAM, and if you have time to wait, it steps down even worse when you hit swap space.
This is not a new problem by the way, the past 10 years have been spent extending RAM bandwidth by widening the bus (32 bit, 64 bit, 128 bit, etc) and also going to DDR (double data rate) and tweaking the Front Side Bus speed.
Is it not possible that the spread is a charting artifact? If the y-axis were drawn with a logarithmic scale, then the approximately 100% spread at each point in time would be scaled and the points would appear to me very much more a horizontal bar.
The previous comment of low-power (and consequently lower poerformance) processors could explain this, but I would think that the fact the data is not stationary is likely to introduce a bias.
@Pekka
The conical shape of the plot shows that suggests an ‘explosion’ of around late 2004. This could be the switch to a new benchmark (
hist(cint$Test.Date, breaks=10)shows an increasing number of measurements until the end of 2012 that then fall off a cliff), the ending of the march of increasing cpu clock frequencies, just happenstance or some combination of factors.Low power systems have been around for a while. Perhaps companies started making/benchmarking more such systems because computers are generally fast enough. Tablets did not really start to have an impact until 2009’ish, well into the trend seen in the plot.
A lot more data analysis is needed to turn this arm waving into something more substantial.