Agreement between code readability ratings given by students
I have previously written about how we know nothing about code readability and questioned how the information content of expressions might be calculated. Buse and Weimer ran a very interesting experiment that asked subjects to rate short code snippets for readability (somebody please rerun this experiment using professional software developers).
I’m interested in measuring how well different students subjects agree with each other (I have briefly written about this before).
Short answer: Very little agreement between individual pairs, good agreement between rankings aggregated by year.
The longer answer is below as another draft section from my book Empirical software engineering with R book. As always comments welcome. R code and data here.
Readability
Source code is often said to have an attribute known as
A study by Buse and Weimer <book Buse_08> asked Computer Science students to rate short snippets of Java source code on a scale of 1 to 5. Buse and Weimer then searched for correlations between these ratings and various source code attributes they obtained by measuring the snippets.
Humans hold diverse opinions, have fragmented knowledge and beliefs about many topics and vary in their cognitive abilities. Any study involving human evaluation that uses an open ended problem on which subjects have had little experience is likely to see a wide range of responses.
Readability is a very nebulous term and students are unlikely to have had much experience working with source code. A wide range of responses is to be expected and the analysis performed here aims to check the degree of readability rating agreement between the subjects.
Data
The data made available by Buse and Weimer are the ratings, on a scale of 1 to 5, given by 121 students to 100 snippets of source code. The student subjects were drawn from those taking first, second and third/fourth year Computer Science degree courses and postgraduates at the researchers’ University (17, 65, 31 and 8 subjects respectively).
The postgraduate data was not used in this analysis because of the small number of subjects.
The source of the code snippets is also available but not used in this analysis.
Is the data believable?
The subjects were not given any instructions on how to rate the code snippets for readability. Also we don’t know what outcome they were trying to achieve when rating, e.g., where they rating on the basis of how readable they personally found the snippets to be, or rating on the basis of the answer they would expect to give if they were being tested in an exam.
The subjects were students who are learning about software development and many of them are unlikely to have had any significant development experience outside of the teaching environment. Experience shows that students vary significantly in their ability to read and write source code and a non-trivial percentage do not go on to become software developers.
Because the subjects are at an early stage of learning about code it is to be expected that their opinions about readability will change while they are rating the 100 snippets. The study did not include multiple copies of some snippets, this would have enabled the consistency of individual subject responses to be estimated.
The results of many studies <book Annett_02> has shown that most subject ratings are based on an ordinal scale (i.e., there is no fixed relationship between the difference between a rating of 2 and 3 and a rating of 3 and 4), that some subjects are be overly generous or miserly in their rating and that without strict rating guidelines different subjects apply different criteria when making their judgements (which can result a subject providing a list of ratings that is inconsistent with every other subject).
Readability is one of those terms that developers use without having much idea what they and others are really referring to. The data from this study can at most be regarded as treating readability to be whatever each subject judges it to be.
Predictions made in advance
Is the readability rating given to code snippets consistent between different students on a computer science course?
The hypothesis is that the between student consistency of the readability rating given to code snippets improves as students progress through the years of attending computer science courses.
Applicable techniques
There are a variety of techniques for estimating rater agreement. <Krippendorff’s alpha> can be applied to ordinal ratings given by two or more raters and is used here.
Subjects do not have to give the same rating to share some degree of consistent response. Two subjects may share a similar pattern of increasing/decreasing/stay the same ratings across snippets. The <Spearman rank correlation> coefficient can be used to measure the correlation between the rank (i.e., relative value within sequence) of two sequences.
Results
When creating the snippets the researchers had no method of estimating what rating subjects would give to them and so there is no reason to expect a uniform distribution of rating values or any other kind of distribution of rating values.
The figure below is a boxplot of the rating of the first 50 code snippets rated by second year students and suggests that many subject ratings are within ±1 of each other.
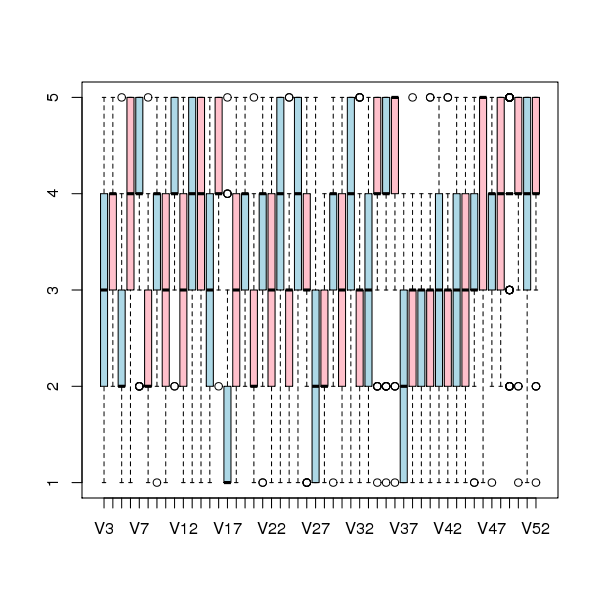
Figure 1. Boxplot of ratings given to snippets 1 to 50 by second year students (colors used to help distinguish boxplots for each snippet).
Between subject rating agreement
The Krippendorff alpha and mean Spearman rank correlation coefficient (the coefficient is calculated for every pair of subjects and the mean value taken) was obtained using the kripp.alpha and meanrho functions from the irr package (a <Jackknife> was used to obtain the following 95% confidence bounds):
Krippendorff's alpha cs1: 0.1225897 0.1483692 cs2: 0.2768906 0.2865904 cs4: 0.3245399 0.3405599 mean Spearman's rho cs1: 0.1844359 0.2167592 cs2: 0.3305273 0.3406769 cs4: 0.3651752 0.3813630 |
Taken as a whole there is a little of agreement. Perhaps there is greater consensus on the readability rating for a subset of the snippets. Recalculating using only using those snippets whose rated readability across all subjects, by year, has a standard deviation less than 1 (around 22, 51 and 62% of snippets respectively) shows some improvement in agreement:
Krippendorff's alpha cs1: 0.2139179 0.2493418 cs2: 0.3706919 0.3826060 cs4: 0.4386240 0.4542783 mean Spearman's rho cs1: 0.3033275 0.3485862 cs2: 0.4312944 0.4443740 cs4: 0.4868830 0.5034737 |
Between years comparison of ratings
The ratings from individual subjects is only available for one of their years at University. Aggregating the answers from all subjects in each year is one method of obtaining readability information that can be used to compare the opinions of students in different years.
How can subject ratings be aggregated to rank the 100 code snippets in order of what a combined group consider to be readability? The relatively large variation in mean value of the snippet ratings across subjects would result in wide confidence bounds for an aggregate based on ratings. Mapping each subject’s rating to a ranking removes the uncertainty caused by differences in mean subject ratings.
With 100 snippets assigned a rating between 1 and 5 by each subject there are going to be a lot of tied rankings. If, say, a subject gave 10 snippets a rating of 5 the procedure used is to assign them all the rank that is the mean of the ranks the 10 of them would have occupied if their ratings had been very slightly different, i.e., (1+2+3+4+5+6+7+8+9+10)/10 = 5.5. This process maps each students readability ratings to readability rankings, the next step is to aggregate these individual rankings.
The R_package[RankAggreg] package contains a variety of functions for aggregating a collection rankings to obtain a group ranking. However, these functions use the relative order of items in a vector to denote rank, and this form of data representations prevents them supporting ranked lists containing items having the same rank.
For this analysis a simple aggregate ranking algorithm using Borda’s method <book lin_10> was implemented. Borda’s method for creating an aggregate ranking operates on one item at a time, combining all of the subject ranks for that item into a single rank. Methods for combining ranks include taking their mean, their geometric mean and the square-root of the sum of their squares; the mean value was used for this analysis.
An aggregate ranking was created for subjects in years one, two and four and the plot below compares the ranking between 1st/2nd year students (left) and 2nd/4th year students (right). The order of the second year student snippet rankings have been sorted and the other year rankings for the snippets mapped to the corresponding position.
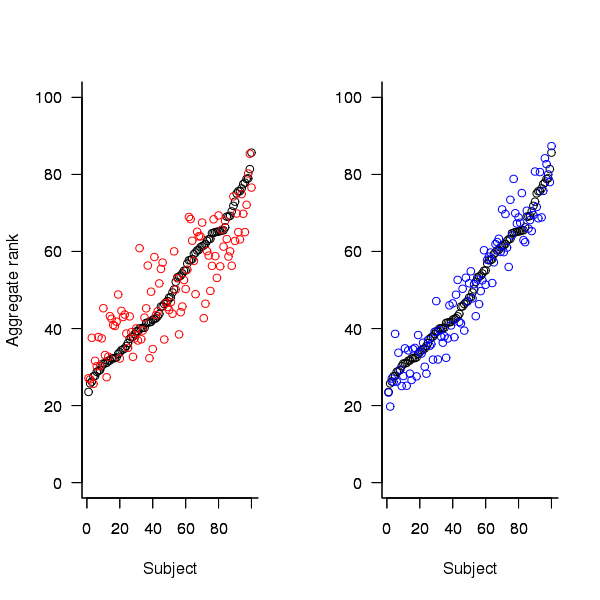
Figure 2. Aggregated ranking of snippets by subjects in years 1 and 2 (red and black) and years 2 and 4 (black and blue). Snippets have been sorted by year 2 ranking.
The above plot seems to show that at the aggregated year level there is much greater agreement between the 2nd/4th years than any other year pairing and measuring the correlation between each of the years using <Kendall’s tau>:
cs1.tau cs2.tau cs3.tau 0.6627602 0.6337914 0.8199636 |
confirms the greater agreement between this aggregate year pair.
Individual subject correlation to year aggregate ranking
To what extend to subject ratings correlate with their corresponding year aggregate? The following plot gives the correlation, using Kendall’s tau, between each subject and their corresponding year aggregate ranking.
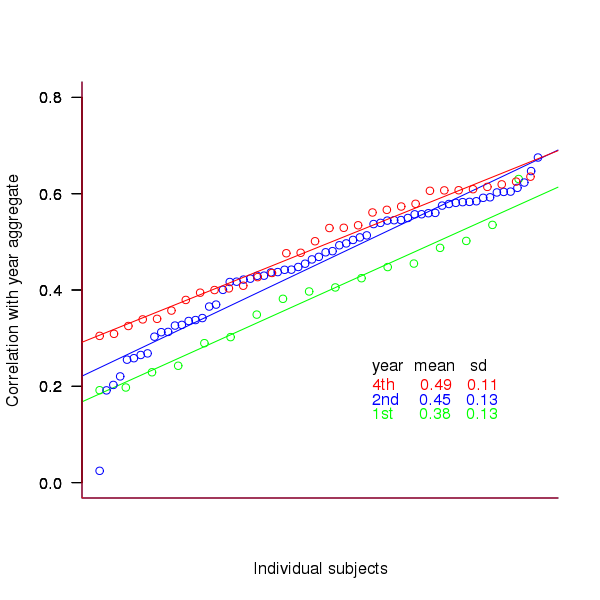
Figure 3. Correlation, using Kendall’s tau, between each subject and their corresponding year aggregate ranking.
The least squares fit shows that the variation in correlation across subjects in any year is very similar (removal of outliers in year 2 would make the lines almost parallel); the mean again shows a correlation that increases with year.
Discussion
The extent to which this study’s calculated values of rater agreement and correlation are considered worthy of further attention depends on the use to which the results will be put.
- From the perspective of trained raters the subject agreement in this study is very low and the rating have no further use.
- From the research perspective the results show that the concept of readability in the computer science student population has some non-zero substance to it that might be worth further study.
- From an overall perspective this study provides empirical evidence for a general lack of consensus on what constitutes readability.
It is not surprising that there is little agreement between student subjects on their readability rating, they are unlikely to have had much experience reading code and have not had any training in rating code for readability.
Professional developers will have spent years working with code and this experience is likely to have resulted in the creation of stable opinions on code readability. While developers usually work with code that is much longer than the few lines contained in the snippets used by Buse and Weimer, this experiment format is easy to administer and supports a fine level of control, i.e., allows a small set of source attributes of interest to be presented while excluding those not of interest. Repeating this study using such people as subjects would show whether this experience results in convergence to general agreement on the readability rating of code.
Summary of findings
The agreement between students readability ratings, for short snippets of code, improves as the students progress through course years 1 to 4 of a computer science degree.
While there is very good aggregated group agreement on the relative ranking of the readability of code snippets there is very little agreement between pairs of individuals.
- Two students chosen at random from within a year will have a low Spearman rank correlation coefficient for their rating of code snippet readability.
- Taken as a yearly aggregate there is a high degree of agreement between years two and four and less, but still good agreement between year 1 and other years.
- There is a broad range of correlations, from poor to good, between year aggregates and student subjects in the corresponding year.
Recent Comments