Sequence generation with no duplicate pairs
Given a fixed set of items (say, 6 A, 12 B and 12 C) what algorithm will generate a randomised sequence containing all of these items with any adjacent pairs being different, e.g., no AA, BB or CC in the sequence? The answer would seem to be provided in my last post. However, turning this bit of theory into practice uncovered a few problems.
Before analyzing the transition matrix approach let’s look at some of the simpler methods that people might use. The most obvious method that springs to mind is to calculate the expected percentage of each item and randomly draw unused items based on these individual item percentages, if the drawn item matches the current end of sequence it is returned to the pool and another random draw is made. The following is an implementation in R:
seq_gen_rand_total=function(item_count) { last_item=0 rand_seq=NULL # Calculate each item's probability item_total=sum(item_count) item_prob=cumsum(item_count)/item_total while (sum(item_count) > 0) { # To recalculate on each iteration move the above two lines here. r_n=runif(1, 0, 1) new_item=which(r_n < item_prob)[1] # select an item if (new_item != last_item) # different from last item? { if (item_count[new_item] > 0) # are there any of these items left? { rand_seq=c(rand_seq, new_item) last_item=new_item item_count[new_item]=item_count[new_item]-1 } } else # Have we reached a state where a duplicate will always be generated? if ((length(which(item_count != 0)) == 1) & (which(item_count != 0)[1] == last_item)) return(0) } return(rand_seq) } |
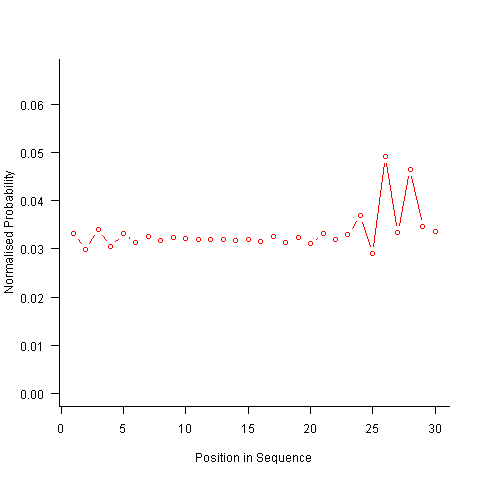
For instance, with 6 A, 12 B and 12 C, the expected probability is 0.2 for A, 0.4 for B and 0.4 for C. In practice if the last item drawn was a C then only an A or B can be selected and the effective probability of A is effectively increased to 0.3333. The red circles in the figure below show the normalised probability of an A appearing at different positions in the sequence of 30 items (averaged over 200,000 random sequences); ideally the normalised probability is 0.0333 for all positions in the sequence In practice the first position has the expected probability (there is no prior item to disturb the probability), the probability then jumps to a higher value and stays sort-of the same until the above-average usage cannot be sustained any more and there is a rapid decline (the sudden peak at position 29 is an end-of-sequence effect I talk about below).
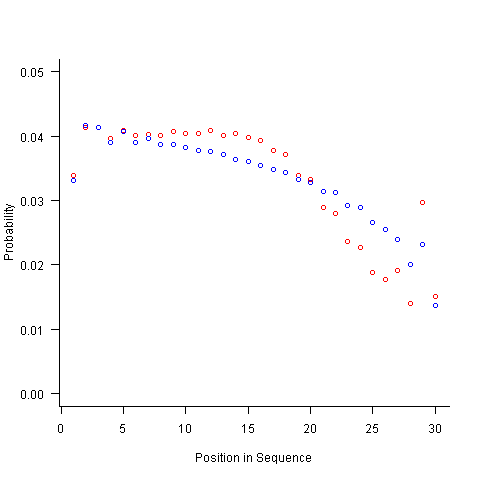
What might be done to get closer to the ideal behavior? A moments thought leads to the understanding that item probabilities change as the sequence is generated; perhaps recalculating item probabilities after each item is generated will improve things. In practice (see blue dots above) the first few items in the sequence have the same probabilities (the slight differences are due to the standard error in the samples) and then there is a sort-of consistent gradual decline driven by the initial above average usage (and some end-of-sequence effects again).
Any sequential generation approach based on random selection runs the risk of reaching a state where a duplicate has to be generated because only one kind of item remains unused (around 80% and 40% respectively for the above algorithms). If the transition matrix is calculated on every iteration it is possible to detect the case when a given item must be generated to prevent being left with unusable items later on. The case that needs to be checked for is when the percentage of one item is greater than 50% of the total available items, when this occurs that item must be generated next, e.g., given (1 A, 1 B, 3 C) a C must be generated if the final list is to have the no-pair property.
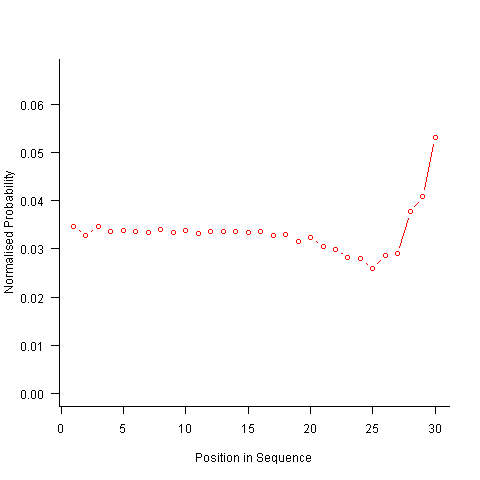
Now the transition matrix approach. Here the last item generated selects the matrix row and a randomly generated value selects the item within the row. Let’s start by generating the matrix once and always using it to select the next item; the resulting normalised probability stays constant for much longer because the probabilities in the transition matrix are not so high that items get used up early in the sequence. There is a small decline near the end and the end-of-sequence effects kick in sooner. Around 55% of generated sequences failed because two of the items were used up early leaving a sequence of duplicates of the remaining item at the end.
Finally, or so I thought, the sought after algorithm using a transition matrix that is recalculated after every item is generated. Where did that oscillation towards the end of the sequence come from?
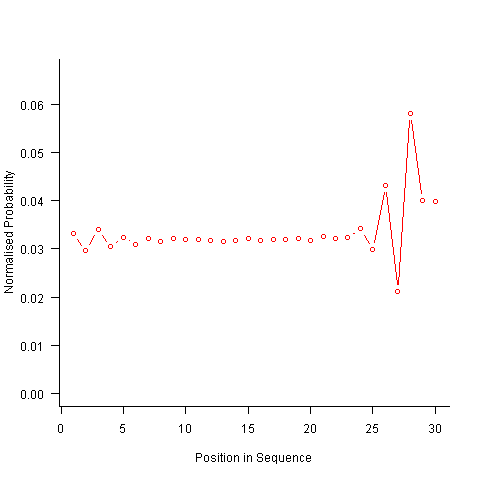
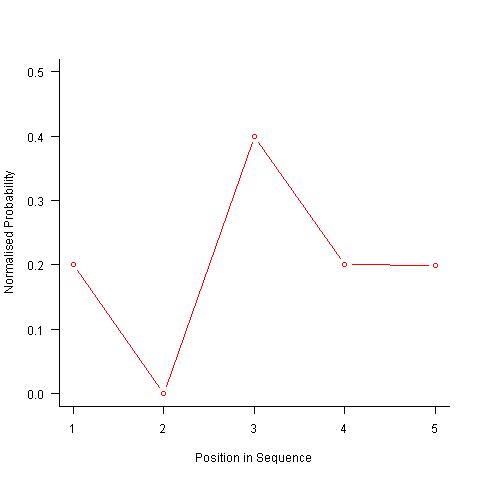
After a some head scratching I realised that the French & Perruchet algorithm is based on redistribution of the expected number of items pairs. Towards the end of the sequence there is a growing probability that the number of remaining As will have dropped to one; it is not possible to create an AA pair from only one A and the assumptions behind the transition matrix calculation break down. A good example of the consequences of this breakdown is the probability distribution for the five item sequences that the algorithm might generate from (1 A, 2 B, 2 C); an A will never appear in position 2 of the sequence:
After various false starts I decided to update the French & Perruchet algorithm to include and end-of-sequence state. This enabled me to adjust the average normalised probability of the main sequence (it has be just right to avoid excess/missing probability inflections at the end), but it did not help much with the oscillations in the last five items (it has to be said that my updated calculations involve a few hand-waving approximations of their own).
I found that a simple, ad hoc solution to damp down the oscillations is to increase any single item counts to somewhere around 1.3 to 1.4. More thought is needed here.
Are there other ways of generating sequences with the desired properties? French & Perruchet give one in their paper; this generates a random sequence, removes one item from any repeating pairs and then uses a random insert and shuffle algorithm to add back the removed items. Robert French responded very promptly to my queries about end-of-sequence effects, sending me a Matlab program implementing an updated version of the algorithm described in the original paper that he tells does not have this problem.
The advantage of the transition matrix approach is that the next item in the sequence can be generated on an as needed basis (provided the matrix is calculated on every iteration it is guaranteed to return a valid sequence if one exists; of course this recalculation removes some randomness for the sequence because what has gone before has some influence of the item distribution that follows). R code used for the above analysis.
I have not been able to locate any articles describing algorithms for generating sequences that are duplicate pair free and would be very interested to hear of any reader experiences.
I don’t have an answer for you, but in any case I don’t think you’re right to expect a flat line for your graphs once you get the algorithm right. In the case of 1A, 2B’s, and 2C’s, there are twelve legal permutations:
abcbc
acbcb
bacbc
bcabc
bcacb
bcbac
bcbca
cabcb
cbabc
cbacb
cbcab
cbcba
The probability of “a” in each position is 1/6, 1/6, 1/3, 1/6, 1/6, so the graph is flat except for a peak in the middle. I don’t have any intuition about what would happen with longer strings, except that probably the glitches would be less pronounced. Maybe they’d be so small it wouldn’t be noticeable?
I think there may be a “simpler” simple approach using the sample function. Using a list of integers to indicate the selected items, we can use a manual without-replacement approach, instead of normalizing the probabilities. Below is a quick function which selects from a list minus whatever was chosen last. You could use your 6A, 12B, 12C example with the code
“> generate_Random_Sequence(c(“A”,”B”,”C”), c(6,12,12), 100)”
Here is the code:
# data_To_Sample is a list of the values to be selected
# data_Probabilities is a list of the relative frequency/probability of each data_To_Sample item
# sequence_Count is an integer indicating the number of items to generate for the sequence
generate_Random_Sequence <- function(data_To_Sample, data_Probabilities, sequence_Count){
# Create selection list
selection_List <- 1:length(data_To_Sample)
# Initialize the previous selection
# We do this, so the first run won't break
previous_Selection <- length(data_To_Sample) + 1
# Initialize sequence
selected_Sequence <- integer(sequence_Count)
# Step through each item, sampling from the set minus
# the previous selection
for (i in 1:sequence_Count){
previous_Selection <- sample(selection_List[-previous_Selection], 1, prob=data_Probabilities[-previous_Selection])
selected_Sequence[i] <- previous_Selection
}
# Return a list using the selected sequence as
# the items to return from our data list
return(data_To_Sample[selected_Sequence])
}
Very sorry, everyone. I misunderstood the problem to be generating a randomized n-length sequence of non-repeating items based on the proportions of a fixed population. Instead, the problem is how to randomly arrange a fixed population without allowing repeating items.
Here is the “real” way to solve this problem using a manual without-replacement method.
“> randomize_List(c(“A”,”B”,”C”), c(6,12,12))”
# This is just a wrapper that tests the last item of the trial
# to see if it failed. If failed, it runs again.
# data_Pool is a list of the values to be selected
# data_Pool_Counts is a list of the number of each value in the pool
randomize_List <- function(data_Pool, data_Pool_Counts){
test_Trial <- 0
while(test_Trial[length(test_Trial)] == 0){
test_Trial <- randomize_Trial(data_Pool, data_Pool_Counts)
}
return(test_Trial)
}
# This is called by the randomize_List wrapper
# data_Pool is a list of the values to be selected
# data_Pool_Counts is a list of the number of each value in the pool
randomize_Trial <- function(data_Pool, data_Pool_Counts){
# Calculate the number of total items
sequence_Length <- sum(data_Pool_Counts)
# Copy the pool counts… this is just a
# coding habit to avoid changing the original
data_Pool_Uses <- data_Pool_Counts
# Initialize the previous selection
# We do this so the first run doesn't break
previous_Selection <- length(data_Pool) + 1
# Initialize the final randomized string
randomized_String <- integer(sequence_Length)
# Step through each item, sampling from the set minus
# the previous selection
for (i in 1:sequence_Length){
# Check to see if the system has run out of valid
# choices, if so, return the current progress
if (sum(data_Pool_Uses[-previous_Selection])<1){
return(randomized_String)
}
# Choose an item based from the items not previously
# chosen and using the remaining pool uses as relative
# frequency
previous_Selection <- sample((1:length(data_Pool))[-previous_Selection], 1, prob=data_Pool_Uses[-previous_Selection])
# Remove the chosen item from the pool
data_Pool_Uses[previous_Selection] <- data_Pool_Uses[previous_Selection] – 1
# Write the corresponding value into the randomized string
randomized_String[i] <- data_Pool[previous_Selection]
}
return(randomized_String)
}
@Dinre
Thanks for proposing a solution. The behavior of this code is very similar to that followed by the blue dots in the first plot.
I tested it using something like the following:
Well, of course it drops off at the end. I wasn’t expecting to solve that solution; I was merely retooling your first bit of code to be more efficient and more conceptually in line with what you’re trying to accomplish. In your original code, you were sampling from the whole set and resampling if you got a duplicate. In my code, duplicates are not possible, and we use the sample function to be more conceptually accurate.
As far as the drop off goes, this is to be expected with any restrained without-replacement function that has uneven frequencies in the pool. The simple fact is that we are more likely to run out of “A” items as we progress, since we are forcing more “A” items to be drawn in order to maintain the non-duplicate restraint. If you want a truly uniform possibility with a draw method, you would need to place the “A” items first and use alternating “B” and “C” items in between gaps of more than 1 place. In placing the “A” items, you would also need to force a balance in how the places were selected in order to prevent predictable spacing.
I can code this up if anyone is interested, but I think you get the idea. The restraints are causing without-replacement to be non-uniform.