Impact of hardware characteristics on detectable fault behavior
Preface. This is the first of what I hope will be many posts analysing experimental data, that will eventually end up in my empirical software engineering with R book (this experiment was chosen because it happens to be the one I am currently working on; having just switched to using Asciidoc I have a backlog of editing to do on previously written analysis, also I have to figure out a way to fix [bracketed words]).
Don’t worry if you don’t know anything about the statistics used. I am aiming to provide information to meet the needs of two audiences (whether or not I fail on both counts remains to be seen):
- Those who want to some idea of what facts are known about a particular software engineering topic. Hopefully reading the introduction+conclusion will enable these readers to form an opinion about the current state of knowledge (taking my statistical analysis on trust).
- Those who are looking for ideas that can be used to analyse a problem they are trying to solve. Hopefully, somewhere among my many analyses will be something that looks like it could be applied to the reader’s problem and motivates them to go off and learn something about the statistics (if they are not already familiar with it; once written the book will obviously help out here).
Forward. The following analysis produces a negative result, something that happens a lot in experiments in all fields of research. It has been included to illustrate the importance of checking the statistical power of an experiment, i.e., how likely the experiment will detect an effect if one is present; it is very easy to fall into the trap of thinking that because lots of tests were done any effect that exists will be detected.
The authors ran an interesting experiment which as far as I know is the only published empirical analysis of intermittent software faults (please let me know if you are aware of other work) and made some mistakes in their statistical analysis. I have made plenty of mistakes in experiments I have run, some of which have found there way into the published write up. The key attribute of an experimentalist is to learn and move on.
A fault does not always noticeably change the behavior of a program when it is executed, apparently correct program execution can occur in the presence of serious faults.
A study by Syed, Robinson and Williams <book Syed_10> investigated how the number of noticeable failures caused by known faults in Mozilla’s Firefox browser varied with processor speed, system memory, hard disc size and system load. A total of 11 known faults causing intermittent failure were selected and nine different hardware configurations were selected. The conditions required to exhibit each fault were replicated and Firefox was executed 10 times for each of hardware configuration, counting the number of noticeable program failures; the seven faults and nine hardware configurations listed in the table below generated a total of 10*7*9 = 630 different executions (four faults either always or never resulted in an observed failure during the 10 runs).
Data
The following table contains the observed number of failures of Firefox for the given fault number when run on the specified hardware configuration.
| Mhz-Mb-Gb | 124750 | 380417 | 410075 | 396863 | 494116 | 264562 | 332330 |
|---|---|---|---|---|---|---|---|
|
667-128-2.5 |
4 |
10 |
6 |
5 |
2 |
3 |
5 |
|
667-256-10 |
4 |
8 |
8 |
6 |
4 |
3 |
8 |
|
667-1000-2.5 |
4 |
7 |
3 |
4 |
3 |
1 |
8 |
|
1000-128-10 |
3 |
10 |
3 |
6 |
0 |
1 |
1 |
|
1000-256-2.5 |
3 |
9 |
0 |
6 |
0 |
1 |
2 |
|
1000-1000-10 |
2 |
9 |
4 |
5 |
0 |
0 |
1 |
|
2000-128-2.5 |
0 |
10 |
5 |
6 |
0 |
0 |
0 |
|
2000-256-10 |
2 |
8 |
5 |
7 |
0 |
0 |
0 |
|
2000-1000-10 |
1 |
7 |
3 |
5 |
0 |
0 |
0 |
Predictions made in advance
There is no prior theory suggesting how the selected hardware characteristics might influence the outcome from this experiment. The analysis is based on searching for a pattern in the results and so the significance level needs to be adjusted to take account of the number of possible patterns that could exist (e.g., using the [Bonferroni correction]).
If we simplify the failure counts by labelling them as one of Low/Medium/High, then there are two arrangements of the failure counts (i.e., low/medium/high and high/medium/low) that would result in a strong correlation for cpu_speed, two arrangements for memory and two for disc size; a total of 6 combinations that would result in a strong correlation being found.
The [Bonferroni correction] adjusts the significance level by dividing by the number of tests, in this case 0.05/6 = 0.0083.
If the failure counts occurred in a random order what is the probability of a strong correlation between failure count and one of the hardware attributes being found? Based on the Low/Medium/High labelling scheme there are 9!/(3! 3! 3!) = 1680 combinations of these counts over 9 slots, giving a 1 in 1680/6 = 280 chance of purely random behavior producing a strong correlation.
The experiment investigated the characteristics of 11 faults. If there is a 1 in 280 chance of finding a strong correlation when analyzing one fault there is approximately a 1 in 24 chance of finding at least one strong correlation when analysing 11 different faults.
Response variable
The response variable takes the form of a proportion whose value varies between 0 and 1, the number of failures out of 10 executions.
Applicable techniques
The following techniques might be used to analyse this data:
- [Factorial design]. This is a way of organizing experiment configurations that is designed to extract the most information for the total number of program runs made. It would be inefficient not to use the results from some hardware configurations just because they are not needed in the factorial design and no results are available for some configurations required by a factorial design (or a [Plackett-Burman] design).
-
Fitting the data using a linear model. A standard linear model, created using R’s lm function, would not be appropriate because of the following two problems:
- this kind of model is likely to make predictions that fall outside the range 0 to 1, something that cannot happen for proportional data,
- this approach assumes that the variance is constant across measurements and unless the proportions involved are very close to each other this requirement will not be met ([proportional data] from a [binomial distribution] has variance p(1-p)).
However, a generalised linear model would not suffer from these problems. There are several [link functions] that could be used:
- the Poisson distribution, is widely used for modelling faults but requires that the mean and variance have the same value, a property that does not apply to proportional data.
- the Binomial distribution, can handle data having the characteristics present here.
The proportional data is specified in the call to the glm function by having the response variable contain two columns, one containing the number of failures (that is what is being predicted in this case) and the other the number of non-failures. The code looks something like the following (see complete example and data):
y=cbind(fail_count, 10-fail_count) glm(y ~ cpu_speed+memory+disk_size, data=ff_data, family=binomial) |
In this kind of GLM it is assumed that the [residual deviance] is the same as the [residual degrees of freedom]. If the residual deviance is greater than the residual degrees of freedom then [overdispersion] has occurred, which happens for fault 380417. To handle overdispersion the family needs to be changed from binomial to quasibinomial, which in the case of fault 380417 changes the p-value of the fit from 0.0348 to 0.0749.
The analysis of each fault finds that only one of them, 332330, has a significance level within the specified acceptable bounds; this has a negative correlation with CPU speed (i.e., observed failures decrease with clock speed).
With only one faults found to have any significant hardware configuration effects we have to ask about the probability of this experiment finding an effect if one was present.
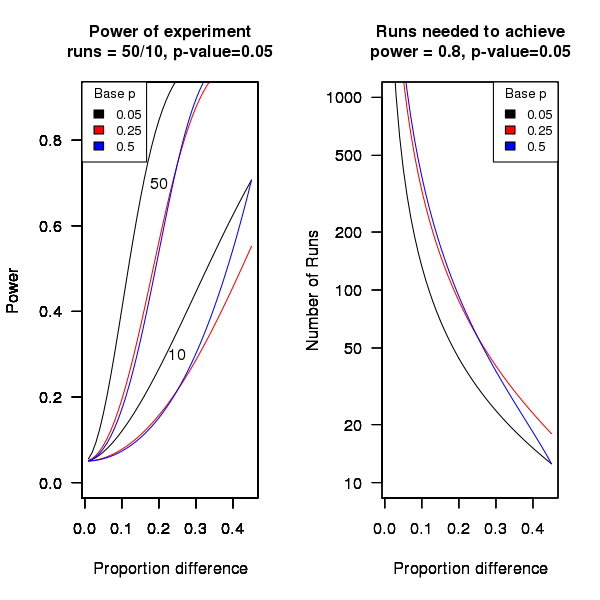
An analysis of the [statistical power] of an experiment investigating the difference between proportions for two hardware configurations (i.e., the percentage of observed failures) needs to know the value of those proportions, the number of runs (10 in this case) and the desired p-value (0.05); to simplify things the plot below is based on using the value of the lowest proportion and the difference between it and the higher proportion. The left plot shows the power achieved (y-axis) there does exist a given difference in proportions (x-axis), the three lowest proportions of 0.05, 0.25 and 0.5 are shown (the result is symmetric about 0.5 and so the plot for 0.75 and 0.95 would be the same as 0.25 and 0.05 respectively), and where there were 10 and 50 runs involving the same fault case.
It can be seen that unless a change in the hardware configuration causes a large change in the number of visible failures then the chance of a difference being detected in results from 10 runs is well below 0.5 (i.e., less than a 50% chance of detecting a difference at a p-value of 0.05 or better).
The right plot in the figure gives the number of runs that need to be made to have a 80% chance of detecting, between two different hardware configurations, the difference in proportion listed on the x-axis, at a significance of 0.05.
It can be seen that if hardware charactersitics account for only 10% of the difference in failure rate over 100 runs would be needed to detect it.
Conclusion
Faults in Firefox that caused intermittent failures were investigated looking for a correlation with system cpu speed, memory or disc size. One fault showed a strong correlation with cpu speed (there is a 1 in 24 chance that one of the investigated faults would have some kind of strong correlation). This experiment may not have found a significant correlation between observed failure rate and hardware configuration because the number of separate runs for each fault (i.e., 10) had [low power].
Recent Comments