Archive
Incompetence borne of excessive cleverness
I have just got back from the 24 hour Data Science Global Hackathon; I was an on-site participant at Hub Westminster in London (thanks to Carlos and his team for doing such a great job looking after us all {around 50 turned up from the 100 who registered; the percentage was similar in other cities around the world}). Participants had to be registered by 11:00 UTC, self form into 3-5 person teams ready for the start at 12:00 UTC and finish 24 hours later. The world-wide event had been organized by our London hosts who told us they expected the winning team to come from those in the room; Team Outliers (Wang, Jonny, Kannappan, Bob, Simon, yours truely and Fran for the afternoon) started in an optimistic mood.
At 12:00 an air-quality training dataset + test points was made available and teams given the opportunity to submit eight predictions in each of the two 12 hour time periods. The on-line submissions were evaluated by Kaggle (one of the sponsors, along with EMC) to produce a mean estimated error that was used to rank teams.
The day before the event I had seen a press release saying that the task would involve air-quality and a quick trawl of the Internet threw up just the R package I needed, OpenAir; I also read a couple of Wikipedia articles on air pollution.
Team Outliers individually spent the first hour becoming familiar with the data and then had a get-together to discuss ideas. Since I had a marker pen, was sitting next to a white-board and was the only person with some gray hair I attempted to manage the herding of the data science cats and later went on to plot the pollution monitor sites on Google Maps as well as producing some visually impressive wind Roses (these did not contribute anything towards producing a better solution but if we had had a client they could have been used to give the impression we were doing something useful).
People had various ideas about the techniques to use for building the best model and how the measurements present in the training set might be used to predict air quality (the training data had names such as target_N_S, where N and S were small integer values denoting the kind of pollution and the site where the measurement was made). The training set included measurements of wind speed/direction data and hours of sunlight, and a couple of members wanted to investigate if these would make good predictors. Team Outliers had people looking at all the fancy stuff you find in textbooks, e.g., ARIMA for time series, svm for machine learning, and I was looking at getting the data into the form needed by OpenAir.
There were all sorts of problems with the data, just like real life, e.g., missing values (lots of them), some kinds of quality (i.e., pollutants) were only measured at one or two sites and fuzzy values such as the ‘most common month’ (what ever that might be). Some people were looking at how best to overcome this data quality problem.
20:30 arrived, and some great food was laid out for dinner, no actual predictions yet, but they would be arriving real soon now. A couple of hours later my data formatting project crashed and burned (being a 32-bit system, R got upset about my request to create a vector needing 5.2 Gig; no chance of using the R-based OpenAir package which needed data in a format different from the one we were given it in). Fifteen minutes to midnight I decided that we either used the eight submissions permitted in the first 12 hours or lost them, and wrote a dozen lines of R that built a linear model using one predictor variable (which I knew from some earlier plots was far from linear, but the coding was trivial, and the lm function would take no time to build separate models for each of the 30 odd response variables). I submitted the predictions, and we appeared on the score board at number 65 out of 112. Being better than 47 other teams was a bit of a surprise.
Panic over, we realised that the 12 hours ended at 12:00 UTC which was 01:00 BST (British Summer time) and we had another hour. Wang made a couple of submissions that improved our score, and at around 02:00 I went to grab a few hours sleep.
I was back online at 06:00 to find that team Outliers had slipped to 95th place as the Melbourne and San Francisco teams had improved during their daytime. More good food for breakfast at 08:30.
Jonny drew attention to the fact that the mean absolute error in our team’s current score was almost twice as great as that of the sample solution provided with the data. We had long ago dismissed this solution as being too simplistic (it was effectively a database solution in that it calculated the mean value of the various pollutants in the training set at various chunkID and hour points which were used as keys for ‘looking up’ prediction values required by the test dataset). Maybe team members ought to focus their attention on tweaking this very simple approach rather than our ‘cleverer’ approaches.
I suggested modifying the sample solution to use the median rather than the mean (less susceptible to outliers), this boosted our ranking back into the 1960s. Jonny and Simon tried using a rolling mean, no improvement; Wang tried other variations, no improvement.
Team Outliers finished the Hackathon in equal 61st, along with 22 other teams, out of 114 submissions.
What did we do wrong? Mistakes include:
- trying to do too much for people with our various skill levels in the time available. For instance, I don’t regularly reformat large data tables or try to calculate the error in machine learning models and while I can easily knock out the code I still have to sit down and think about what needs to be written, something that somebody who does this sort of thing regularly would just know how to do; other team members seemed very familiar with the theory but were not used to churning out code quickly.
- spending too much time studying all the various kinds of measurements available in the training set, many of which were not available in the test dataset. We should have started off ignoring measurements in the training set that were not available in the test set, perhaps looking to using these later if time permitted.
Members of team Outliers enjoyed themselves but were a little crestfallen that our clever stuff was not as good as such a crude, but insightful, approach. Most of us used R, a few made use of awk, Python, spreadsheets and Unix shell.
Our hosts are looking to run more data science hackathons this year, in particular one related to the music industry in a few months time. If you are interested in taking part, keep an eye on their website.
Update (later the next day)
At least one team achieved some good results using ARIMA. Fran had started building an ARIMA model, had to leave and nobody else picked it up; I should have been paying more attention to ensure that ideas did not disappear when people left.
An academic programming language paper about R
The R language has passed another milestone, a paper aimed at the academic programming language community (or at least one section of this community) has been written about it, Evaluating the Design of the R Language by Morandat, Hill, Osvald and Vitek. Hardly earth shattering news, but it may have some impact on how R is viewed by nonusers of the language (the many R users in finance probably don’t care that R seems to have been labeled as the language for doing statistics). The paper is well written and contains some very interesting information as well as a few mistakes, although it will probably read like gobbledygook to anybody not familiar with academic programming language research. What follows has something of the form of an R users guide to reading this paper, plus some commentary.
The paper has roughly three parts, the first gives an overview of R, the second is a formal definition of a subset and the third an initial report of an analysis of R usage. For me and I imagine you dear reader the really interesting stuff is in the third section.
When giving a language overview to people who know other computer languages it makes sense to leverage that knowledge, this is why the discussion has a world view from the perspective of languages rarely associated with R: Scheme, Haskell and CLOS. I found some of the discussion of R constructs to be much more informative and less confusing than that in nearly all R books/tutorials I have read, but then they are written from a detailed operational programming language perspective. One criticism of this overview is that it does not give any hint as to why R has such a large following (saying that users found it more useful than these languages would send the wrong kind of signal ;-).
What is a formal description of a subset of R (i.e., done purely using mathematics) doing in the second part? Well, until recently very little academic software engineering was empirically based and was populated by people I would classify as failed mathematicians without the common sense needed to be engineers. Things are starting to change but research that measures things, particularly people, is still regarded as not being respectable in some quarters. In this case the formal definition is playing the role of a virility symbol showing that the authors are obviously regular guys who happen to be indulging in a bit of empirical research.
A surprising number of papers measuring the usage of real software contain formal definitions of a subset of the language being measured. Subsets are used because handling the complete language is a big project that usually involves one or more people getting a PhD out of the work. The subset chosen have to look plausible to readers who understand the mathematics but not the programming language, broadly handle all the major constructs but not get involved with all the fiddly details that need years of work and many pages to describe.
The third part contains the real research, which is really about one implementation of R and the characteristics of R source in the CRAN and Bioconductor repositories, and contains lots of interesting information. Note: the authors are incorrect to aim nearly all of the criticisms in this subsection at R, these really apply to the current implementation of R and might not apply to a different implementation.
In a previous post I suggested some possibilities for speeding up the execution of R programs that depended on R usage characteristics. The Morandat paper goes a long way towards providing numbers for some of these usage characteristics (e.g., 37% of function parameters are assigned to and 36% of vectors contain a single value).
What do we learn from this first batch of measurements? R users rarely use many of the more complicated features (e.g., object oriented constructs {and this paper has been accepted at the European Conference on Object-Oriented Programming}), a result usually seen for other languages. I was a bit surprised that R programs were only 40% smaller than equivalent C programs. I think part of the reason is that some of the problems used for benchmarking are not the kind that would usually be solved using R and I did not see any ‘typical’ R programs being coded up in C for comparison, another possibility is that the authors were not thinking in R when writing the code.
One big measurement topic the authors missed is comparing their general findings with usage measurements of other languages. I think they will find lots of similar patterns of usage.
The complaint that R has been defined by the successive releases of its only implementation, rather than a written specification, applies to all widely used languages, at least in their early days. Back in the day a major reason for creating language standards for Pascal and then C was so that other implementations could be created; the handful of major languages whose specification was written before the first implementation (e.g., PL/1, Ada) have/are dieing out. Are multiple implementations needed in an Open Source world? The answer seems to be no for Perl and yes for PHP, Ruby etc. The effort needed to create a written specification for the R language might be better invested improving the efficiency of the current implementation so that a better alternative is not needed.
Needless to say the authors suggested committing the fatal programming language research mistake.
The authors have created an interesting set of tools for static and dynamic analysis of R and I look forward to reading more about their findings in future papers.
Using identifier prefixes results in more developer errors
Human speech communication has to be processed in real time using a cpu with a very low clock rate (i.e., the human brain whose neurons fire at rates between 10-100 Hz). Biological evolution has mitigated the clock rate problem by producing a brain with parallel processing capabilities and cultural evolution has chipped in by organizing the information content of languages to take account of the brains strengths and weaknesses. Words provide a good example of the way information content can be structured to be handled by a very slow processor/memory system, e.g., 85% of English words start with a strong syllable (for more details search for initial in this detailed analysis of human word processing).
Given that the start of a word plays an important role as an information retrieval key we would expect the code reading performance of software developers to be affected by whether the identifiers they see all start with the same letter sequence or all started with different letter sequences. For instance, developers would be expected to make fewer errors or work quicker when reading the visually contiguous sequence consoleStr, startStr, memoryStr and lineStr, compared to say strConsole, strStart, strMemory and strLine.
An experiment I ran at the 2011 ACCU conference provided the first empirical evidence of the letter prefix effect that I am aware of. Subjects were asked to remember a list of four assignment statements, each having the form id=constant;, perform an unrelated task for a short period of time and then recall information about the previously seen constants (e.g., their value and which variable they were assigned to).
During recall subjects saw a list of five identifiers and one of the questions asked was which identifier was not in the previously seen list? When the list of identifiers started with different letters (e.g., cat, mat, hat, pat and bat) the error rate was 2.6% and when the identifiers all started with the same letter (e.g., pin, pat, pod, peg, and pen) the error rate was 5.9% (the standard deviation was 4.5% and 6.8% respectively, but ANOVA p-value was 0.038). Having identifiers share the same initial letter appears to double the error rate.
This looks like great news; empirical evidence of software developer behavior following the predictions of a model of human human speech/reading processing. A similar experiment was run in 2006, this asked subjects to remember a list of three assignment statements and they had to select the ‘not seen’ identifier from a list of four possibilities. An analysis of the results did not find any statistically significant difference in performance for the same/different first letter manipulation.
The 2011/2006 experiments throw up lots of questions, including: does the sharing a prefix only make a difference to performance when there are four or more identifiers, how does the error rate change as the number of identifiers increases, how does the error rate change as the number of letters in the identifier change, would the effect be seen for a list of three identifiers if there was a longer period between seeing the information and having to recall it, would the effect be greater if the shared prefix contained more than one letter?
Don’t expect answers to appear quickly. Experimenting using people as subjects is a slow, labour intensive process and software developers don’t always answer the question that you think they are answering. If anybody is interested in replicating the 2011 experiment the tools needed to generate the question sheets are available for download.
For many years I have strongly recommended that developers don’t prefix a set of identifiers sharing some attribute with a common letter sequence (its great to finally have some experimental backup, however small). If it is considered important that an attribute be visible in an identifiers spelling put it at the end of the identifier.
See you all at the ACCU conference tomorrow and don’t forget to bring a pen/pencil. I have only printed 40 experiment booklets, first come first served.
Randomizing a list of items using sort() and rand()
I’m busy putting together the experiment I will be running at the ACCU conference next week. If you are attending the conference please reserve your Thursday lunchtime slot for taking part as a subject!
Experiment generation invariably involves randomizing the sequence of items seen by every subject. While few languages support a randomise function many support sorting and random number generation. These two functions can be combined to create a randomize function; simply append a random number to the start of each item, sort it and then strip off the random number. Voilà a randomized list (awk code below).
function rand_items(items) { for (v in items) { items[v]=rand() " " items[v] } asort(items) for (v in items) { sp_pos=index(items[v], " ") items[v]=substr(items[v], sp_pos+1) } } |
This randomization problem is not yet listed on Rosetta code and probably has longer solutions in other languages.
Update (the next day).
The glow I have had for the last 10 years over coming up with a neat solution to a problem has now disappeared. Following the link kindly provided by D. Herring in the comments eventually lead me to the Fisher-Yates shuffle, which has ") performance (the call to sort is probably
performance (the call to sort is probably ") . The following shuffles a deck of cards:
. The following shuffles a deck of cards:
for (i = 0; i < 52; i++) { j = i + (rand() % (52 - i)); tmp = card[i]; card[i] = card[j]; card[j] = tmp; } |
The proof of the uniform shuffling behavior of Fisher-Yates (also known as Knuth shuffle) is straight forward but not nearly as appealing as using rand and sort.
A free pdf that is not the C++ Standard
One of the most annoying things about working on programming language standards is to see the exorbitant price ISO charge for the final published document created by experts toiling away for free over many years. This practice is unlikely to change.
Once a document has been through a successfully ballot (i.e., accepted for publication as a Standard) ISO has very strict rules about what changes can be made to it prior to actual publication (only typos of the most very innocuous kind can be fixed). Of course programming language committees live on after the publication of a Standard by ISO and it is very useful for them if the document they start deliberating on is one that has had all the typos corrected, not just the really innocuous ones.
The list of typos in the 2011 C++ Standard have been fixed in the freely down loadable committee document N3337 that is not the official C++ Standard, however uncannily similar it may look (no ISO gobbledygook at the front for instance). The equivalent committee document for C is not yet available on the WG14 site.
If you really do need a copy of the C++ Standard the 2011 (i.e., latest) document in pdf form is available for $30 from ANSI; the 2011 C Standard is also available for the same price. Don’t worry about the ANSI version being dated 2012 rather than 2011; National Standards bodies must sell the ISO version at ISO prices but are allowed to publish localized versions for which they can set their own price (so you pay less and get various US specific acronyms and verbiage printed on the front cover).
Generating code that looks like it is human written
I am very interested in understanding the patterns of developer behavior that lead to the human characteristics that can be found in code. To help me get some idea of how well I understand this behavior I have decided to build a tool that generates source code that appears to be written by human programmers. I hope to reach a point where I can offer a challenge to tell the difference between generated code and human written code.
The three main production techniques I plan to use are, in increasing order of relatedness to humans production techniques, are:
- Random generation based on percentage occurrence of language constructs obtained from measurements of existing source. This is the simplest approach and the one furthest away from common developer behavior; even so there are things that can be learned from this information. For instance, the theory that developers are more likely to create a function once code becomes heavily nested code implies that the probability of encountering an if-statement decreases as nesting depth increases; measurements show the probability of encountering an if-statement remaining approximately constant as depth of nesting increases.
- Behavior templates. People have habits in everyday life and also when writing software. While some habits are idiosyncratic and not encountered very often there are some that appear to be generally used. For instance, developers tend to assign a fixed role to every variable they define (e.g., stepper for stepping through a succession of values and most-recent holder holding the latest value encountered in going through a succession of values).
I am expecting/hoping that generation by behavioral templates will result in code having some of the probabilistic properties seen in human code, removing the need for purely random generation driven by low level language probability measurements. For instance, the probability of a local variable appearing in a function is proportional to the percentage of its previous occurrences up to that point in the source of the function (
percentage = occurrences_of_X / occurrences_of_all_local_variables) and I am hoping that this property appears as emergent behavior from generating using the role of variable template. - Story telling. A program is like the plot of a story, it has a cast of characters (e.g., classes, functions, libraries) that perform various actions and interact with each other in order to achieve various goals, there are subplots (intermediate results are calculated, devices are initialized, etc), there are resource limits, etc.
While a lot of stories are application domain specific there are subplots common to many stories; also how a story is told can be heavily influenced by the language used, for instance Prolog programs have a completely different structure than those written in procedural languages such as Java. I want to stay away from being application specific and I don’t plan to tackle languages too far outside the common-or-garden procedural variety.
Researchers have created automatic story generators; the early generators were template based while more recent systems have used an agent based approach. Story based generation of code is my ideal, but I am a long way away from having enough knowledge of developer behavior to be more than template based.
In a previous post I described a system for automatically generating very simply C programs. I plan to build on this system to incrementally improve the ‘humanness’ of the generated code. At some point, hopefully before the end of this year, I will challenge people to tell the difference between automatically generated and human written code.
The language I have studied the most is C and this will be the main target. I don’t want to be overly C specific and am trying to decide on a good second language (i.e., lots of source available for measurement, used by lots of developers and not too different from C). JavaScript is the current front runner, it is a class-less object oriented language which is not ‘wildly’ OO (the patterns of usage in human written OO code continue to evolve at a rapid rate which can make a lot of human C++/Java code look automatically generated).
As well as being a test bed for understanding of human generated code other uses for an automatic generator include compiler stress testing and providing code snippets to an automated fault fixing tool.
Unique values generated by expressions of a given complexity
The majority of integer constants appearing in source code can be represented using a few bits. CPU designers use this characteristic when designing instruction sets, creating so called short-form or quick instructions that perform some operation involving small integer values, e.g., adding a value between 1 and 8 to a register. Writers of code optimizers are always looking for sequences of short-form instructions that are faster/smaller than the longer forms (the INMOS Transputer only had a short form for load immediate).
I have recently been looking at optimizing expressions written for a virtual machine that only supports immediate loads of decimal values between 1 an 9, and binary add/subtract/multiply/divide, e.g., optimizing an expression containing four operators, ((2*7)+9)*4+9 which evaluates to 101, to one containing three operators, (8+9)*6-1 also evaluates to 101. Intermediate results can have fractional values, but I am only interested in expressions whose final result has an integer value (i.e., zero fractional part).
A little thought shows that the value of an expression containing a subexpression whose value includes a fractional value (e.g., 1/3) can always be generated by an expression containing the same or a fewer number of operators and no intermediate fractional value intermediate results (e.g., 9/(1/5) can be generated using 9*5, i.e., the result of any divide operation always has to be an integer if the final result is to be a unique integer. Enumerating the unique set of values generated by expressions containing a given number of operators shows that divide is redundant for expressions containing six of fewer operators and only adds 11 unique values for seven operators (379,073 possibilities without divide)
Removing support for the minus operator only reduces the size of the result set by around 10%. Possibly being worthwhile time saving for expressions containing many operators or searching for an expression whose result value is very large.
There does not appear to be a straightforward (and fast) algorithm that returns the minimal operation expression for a given constant.
I wrote an R program to exhaustively generate all integer values returned by expressions containing up to seven operators. To find out how many different values, integer/real, could be calculated I wrote a maxima program (this represents fractional values using a rational number representation and exceeds 4G byte of storage for expressions containing more than five operators).
The following figure shows the number of different values that can be generated by an expression containing a given number of operators (blue), the number of integer values (black), the number of positive integer values (red), the smallest positive integer that cannot be calculated by an expression containing the given number of operators (green) (circles are for add/subtract/multiply/divide, squares for add/multiply). Any value below a green line is guaranteed to have a solution in the in the given number of operators (or fewer). The blue diamond line is the mean value of a random expression containing the given number of operators.
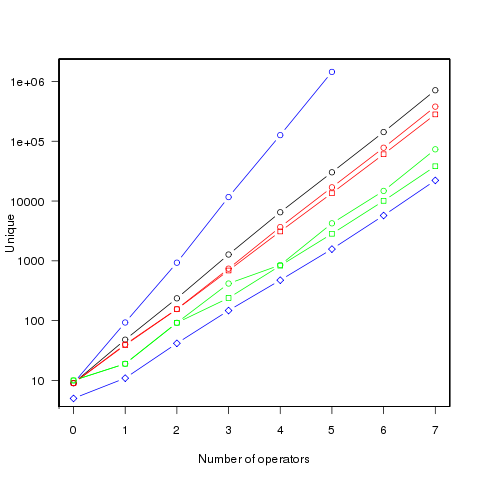
Limiting the operators to just add/multiply reduces the number of unique value possibilities. The difference increases linearly’ish to around 35% for seven operators.
The following uses colors to show the minimum number of operators needed to generate the given value, 1 is in the bottom left, 100,000 in the top right; red for one operator, yellow for two, green for three and so on.
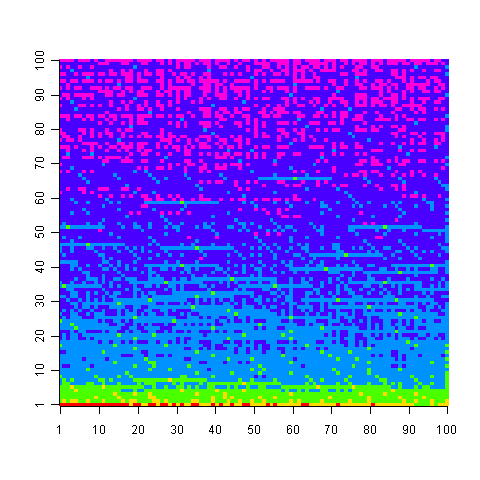
Knowing that N can be calculated using p operators does not mean that N-1 can also be generated using p operators; it is possible to generate 729 using two operators (i.e., 9*9*9), three operators are required to generate 92 and four to generate 417.
Values under the green line (first figure) are known to have solutions in the given number of operators; quickly obtaining the solution is another matter. There is at least a 50/50 chance that a randomly generated expression containing the given number of operators, and producing an integer value, will calculate a value on or below the diamond blue line. The overhead of storing precomputed minimal operator expressions is not that great for small numbers of operators.
Suggestions for a fast/low storage algorithm (random generation + modification through a cost function performs quite well) for large integer values welcome.
Update. Values from the first figure have been accepted by the On-Line Encyclopedia of Integer Sequences as entries: A181898, A181957, A181958, A181959 and A181960.
Recent Comments