Behavior patterns in Colonel Blotto
People look for patterns and expect others to follow patterns of behavior. Some preliminary data from a game of Colonel Blotto run by a group of Cornell University graduate students provides a vivid example of the existence of these behavior patterns.
In the Cornell implementation of the Colonel Blotto game, there are 10 fields and 100 soldiers. A player specifies how many soldiers are posted to each of the 10 fields. Players don’t know what the opposing players will do. In each field the battle is decided by whoever has the most soldiers with equal numbers resulting in a draw. Whoever wins the most battles wins the war.
One possible soldiers per field sequence is 10 10 10 10 10 10 10 10 10 10 and another is 1 11 11 11 11 11 11 11 11 11. The second sequence will lose in the first field, but win the other 9, and therefore win the war. A third sequence is 9 11 12 12 12 12 8 8 8 8 which beats the second sequence but only draws against the first.
The number of ways of placing  indistinguishable soldiers into
  fields is:
")
 = 4263421511271 approx 4.3 10^12")
The following original analysis assumes that the soldiers are distinguishable, which they are not and so the number calculated is way too large (thanks to Forbes at The Virtuosi for pointing this out): There are 10 ways of placing the first soldier, 10 ways of placing the second and so on, giving  possible arrangements.
Some arrangements obviously always lose (25 25 25 25 0 0 0 0 0 0) and won’t be played; it seems reasonable to assume that no field will contain zero (I will talk about putting 0 in one field later), so having a field contain 1 is a draw at best. Lets assume that all fields contain at least 2 soldiers, which means we have 80 left to arrange giving  possibilities; a very big drop in possibilities but still a huge number.
 = 635627275767 approx 6.4 10^11")
The more soldiers appearing in a field the more likely a win will occur there, but after a while the law of diminishing returns kicks in and losses occurring in understaffed fields will be greater. Lets assume that people decide never to put more than 20 soldiers in a field; how many possibilities does this rule out? If one field initially contains 21 soldiers and the others 2 each the remaining 61 soldiers create  unused possibilities, putting 21 soldiers in the second field generates a bit less than new possibilities; lets round up and say there are a total of
  unused possibilities. Compared to the unused is small enough to be ignored.
is such a big number that Chimpanzees randomly typing away since the dawn of time are unlikely to create any discernible pattern in the landscape.
If the players in this game had given random answers what would be the mean number of points scores and its variance?
Comparing the soldier sequence given by player A against the sequence given by player B produces 11 possible scores, {0, 10}, {1, 9} … {5, 5} … {10, 0}, five of them resulting in a win for A, five in a win for B and one in a draw. With 2 points for a win, 1 point for a draw and 0 points for a loss the expected number of points for each of the two players is 1, so for  players the expected mean of each player is . In a game containing 550 players (the number that had played when I extracted the score results today; 347 had played in the preliminary Cornell data set) we would expect the average score to be 550.
The variance can be calculated from:
![Var(X) = E[X^2] - E[X]^2](https://shape-of-code.com/wp-content/plugins/wpmathpub/phpmathpublisher/img/math_981_10ef7d904d4c247085b083f7a763b015.png "Var(X) = E[X^2] - E[X]^2")
![E[X^2] = (5/11) 0^2 + (1/11) 1^2 + (5/11) 2^2 = 21/11](https://shape-of-code.com/wp-content/plugins/wpmathpub/phpmathpublisher/img/math_981_0c575aade39de873edea4b12e2e88914.png "E[X^2] = (5/11) 0^2 + (1/11) 1^2 + (5/11) 2^2 = 21/11")
 = 21/11 - 1^2 = 10/11")
The standard deviation about our mean is  or 22.4.
Plotting a histogram of points scored, at the time of writing, we get the following:
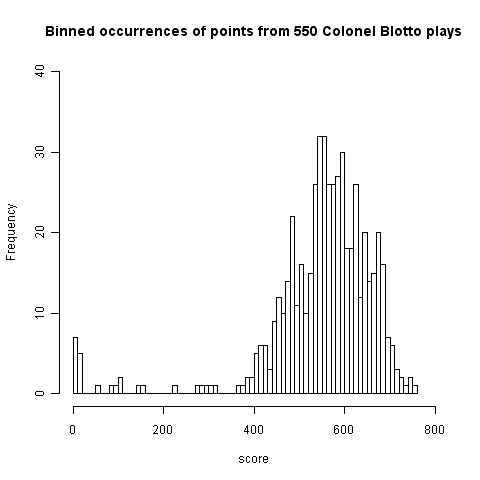
This has a peak at 550 where we would expect it and its width is two standard deviations 🙂 However those ‘side-lobes’ were not expected and they are asymmetric. I think the reason for these unexpected ‘side-lobes’ is that some players give multiple answers, attempting to improve their ranking (some strategy name are suggestive of retries with modified strategies) and consequently decreasing the total points of other players. A search space of sequences is so large that we would not expect players to be able to learn from the results of previously submitted sequences unless many of the previously submitted sequences followed some pattern that they could recognise.
What pattern of behavior might players follow? I can imagine players starting low/high and then shifting to high/low, perhaps following this sequence two or more times.
A preliminary summary of some of the data seen so far by Alex Alemi gave me enough information to figure out a sequence, in three attempts, that ranked 1st (a typo on my part prevented it being on the second attempt); my sequence of player names is averages, aver_p6, low_high_dip, followed by a bit of tuning: low_high_dipish, lohilohi_slide, followed by two experiments: the_well, heat_map, and user fooly started getting close and I tuned the sequence a bit more lohilohi_sliiide.
I used the sequences from the top 25 ranked players for my analysis and did not make any attempt to deduce other player patterns. My first attempt averaged the number of soldiers in each field, ranked 62nd as I write (aver_p6). Then I spotted that several distribution patterns existed, I picked what looked like the most promising and averaged over it (by eye) to get the then current to number 1 (currently languishing in 8th).
Had I put a bit more thought into things I could also have used the heat map near the bottom of the post (thanks to Alex Alemi for letting me post a copy here; “With Y soldiers in slot X, what percentage of the existing strategies do you beat in slot X.”):
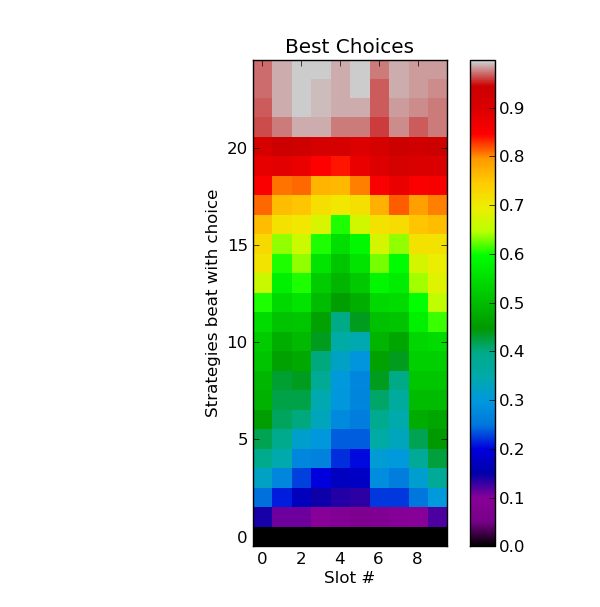
This shows one pattern (in light blue) where players are following the pattern low-high-low-high-low with the second low being very precipitous. The patterns visible in green are more complicated, but still contain a recurring low-high theme.
I know next to nothing about autocorrelation and so do not have any bright ideas about how to use of this data to improve my score. The heat_map sequence (7 8 9 12 15 16 9 11 7 6) attempts to follow the light blue pattern and is ranked 296 as I write, just under half way down the rankings and something to be expected from following an average.
Once a major pattern has been deduced ‘extra’ soldiers will be needed to outnumber the other players most of the time. One option is to be willing to always lose in one field (e.g., the one usually requiring the most soldiers) and use the freed up resources to win elsewhere. I have only made one attempt using this strategy (the_well: 5 6 7 11 19 0 14 20 13 5, ranked 72 as I write).
It is possible that common patterns of behavior are created through reinforcement. Early players create an initial configuration of results and slightly later players attempt to find it, perhaps visualizing a pattern where none actually exists. If enough people follow the same trail they will create the pattern that others can will try to follow. Results from other Colonel Blotto games exhibit a pattern of behavior that is different from the one in the Cornell dataset (I have only seen what is publicly available)
-
August 13th, 2010 at 17:02 | #1The Virtuosi: The Wrath of Blotto | Git My Bits
Recent Comments